 Read time: 9 mins


10 types of process modeling techniques explained, with examples
Mapping out business processes from end-to-end is a critical part of solving complex tasks and optimizing workflows. But it also comes with its own share of challenges: How can you make sure all stakeholders are on the same page? How do you depict complicated systems and steps?
When implemented effectively, business process modeling can transform project management challenges into opportunities for shared understanding, innovation, and success.
Fundamentally, business process modeling involves identifying, defining, and representing a process in its entirety, in order to aid communication of that process.
The visual references and diagrams used in modeling systems can help you:
- Identify tasks that are redundant and remove them
- Spot bottlenecks in the process and improve process efficiency by eliminating them
- Identically repeat processes and train new staff to do so
There are several techniques in business process modeling:
1. Business Process Modeling Notation (BPMN)
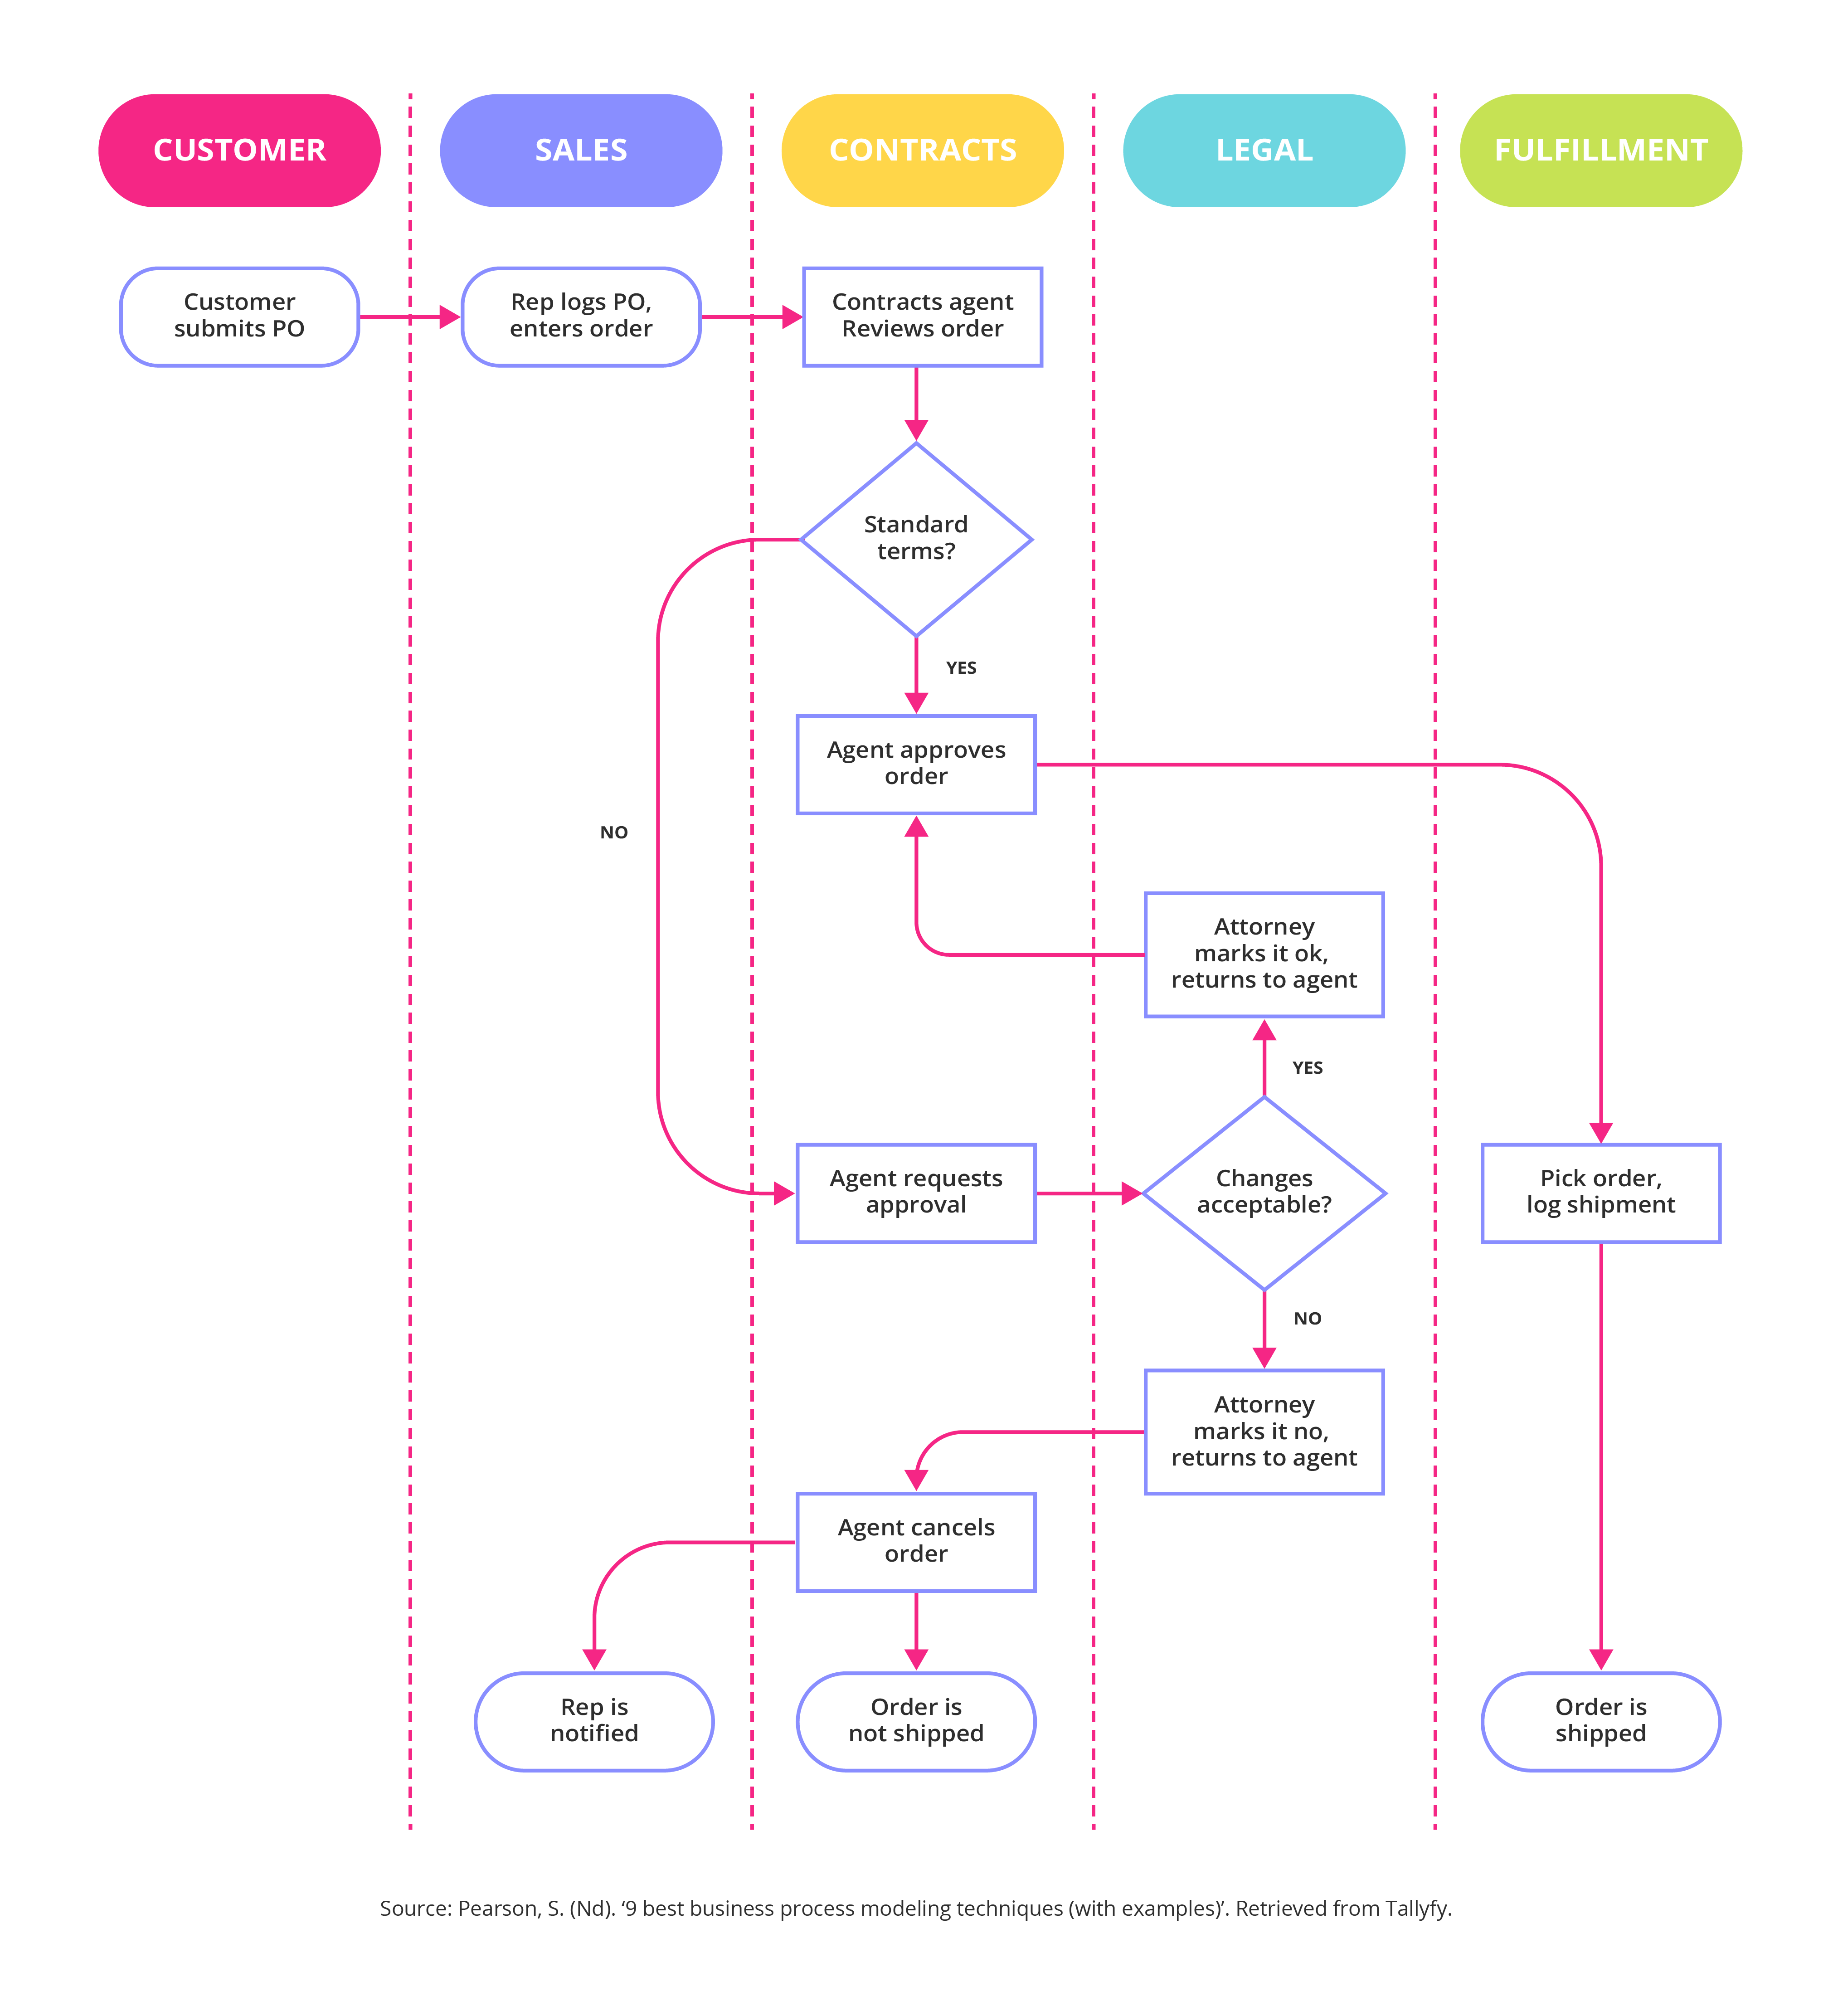
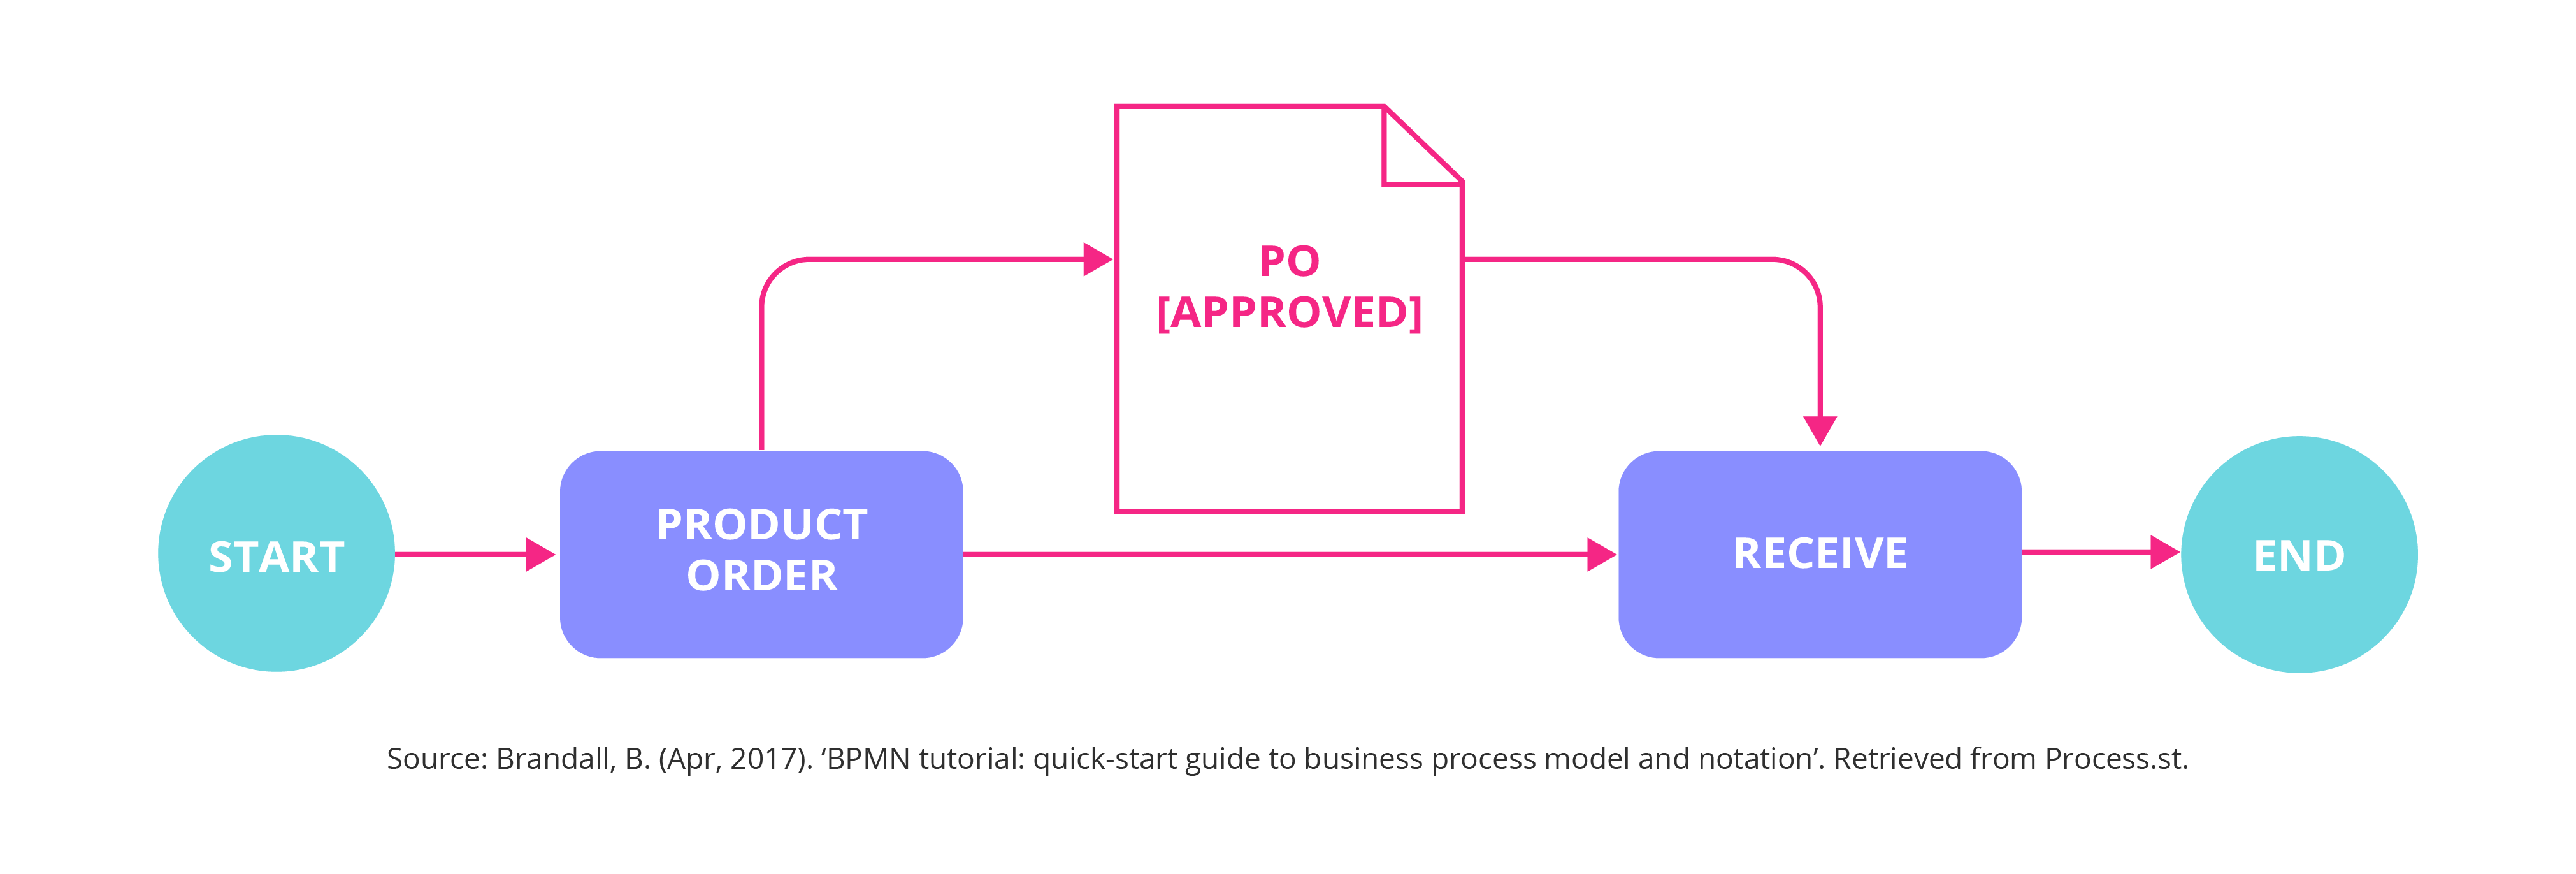
The Business Process Model and Notation (BPMN) is the global standard for modeling business processes. It is composed of a system of graphical notations used to visualize end-to-end tasks and workflows. Designed for stakeholders who manage and design business processes, BPMN emphasizes a combination of ease-of-use and specificity to meet the different needs of global organizations.1
Strengths:2
- Individual organizations don’t need to invent their own visual system
- A standardized language helps close communication gaps between stakeholders
- Includes a library of process flows and rules to train new employees on
- Can be created using online tools like LucidChart and Visio
Limitations:3
- The highly rigid framework can make process innovation more complicated
- Challenging for first-time users to read
- May not be flexible for certain dynamic and non-sequential processes
BPMN symbols fall into the following basic categories:4
- Flow objects. The main elements that define a process are broken into three types of objects:
- Events are displayed inside circles. These are things that “happen” during the course of a process and usually have a cause and impact.
- Activities fit into rectangular boxes. This represents the work performed within a process.
- Gateways are represented as diamond shapes. These are used to control how the process flows and either converges or diverges.
- Connecting objects. Show how tasks are connected and in what sequence they occur.
- Sequence flows are displayed as solid lines. These depict the order of activities.
- Message flows are displayed as dashed lines. These depict the transfer of information between participants.
- Swimlanes. Make provisions for partitioning a set of activities from others. They comprise “Pools” and “Lanes”.
- Artifacts. Provides additional information that isn’t captured in a sequence or message, but does not directly affect the process.5
-
- Groups use dot-dash rectangles to logically relate components.
- Text annotations are displayed inside square brackets.
- Associations link text annotations to other elements via dotted lines.
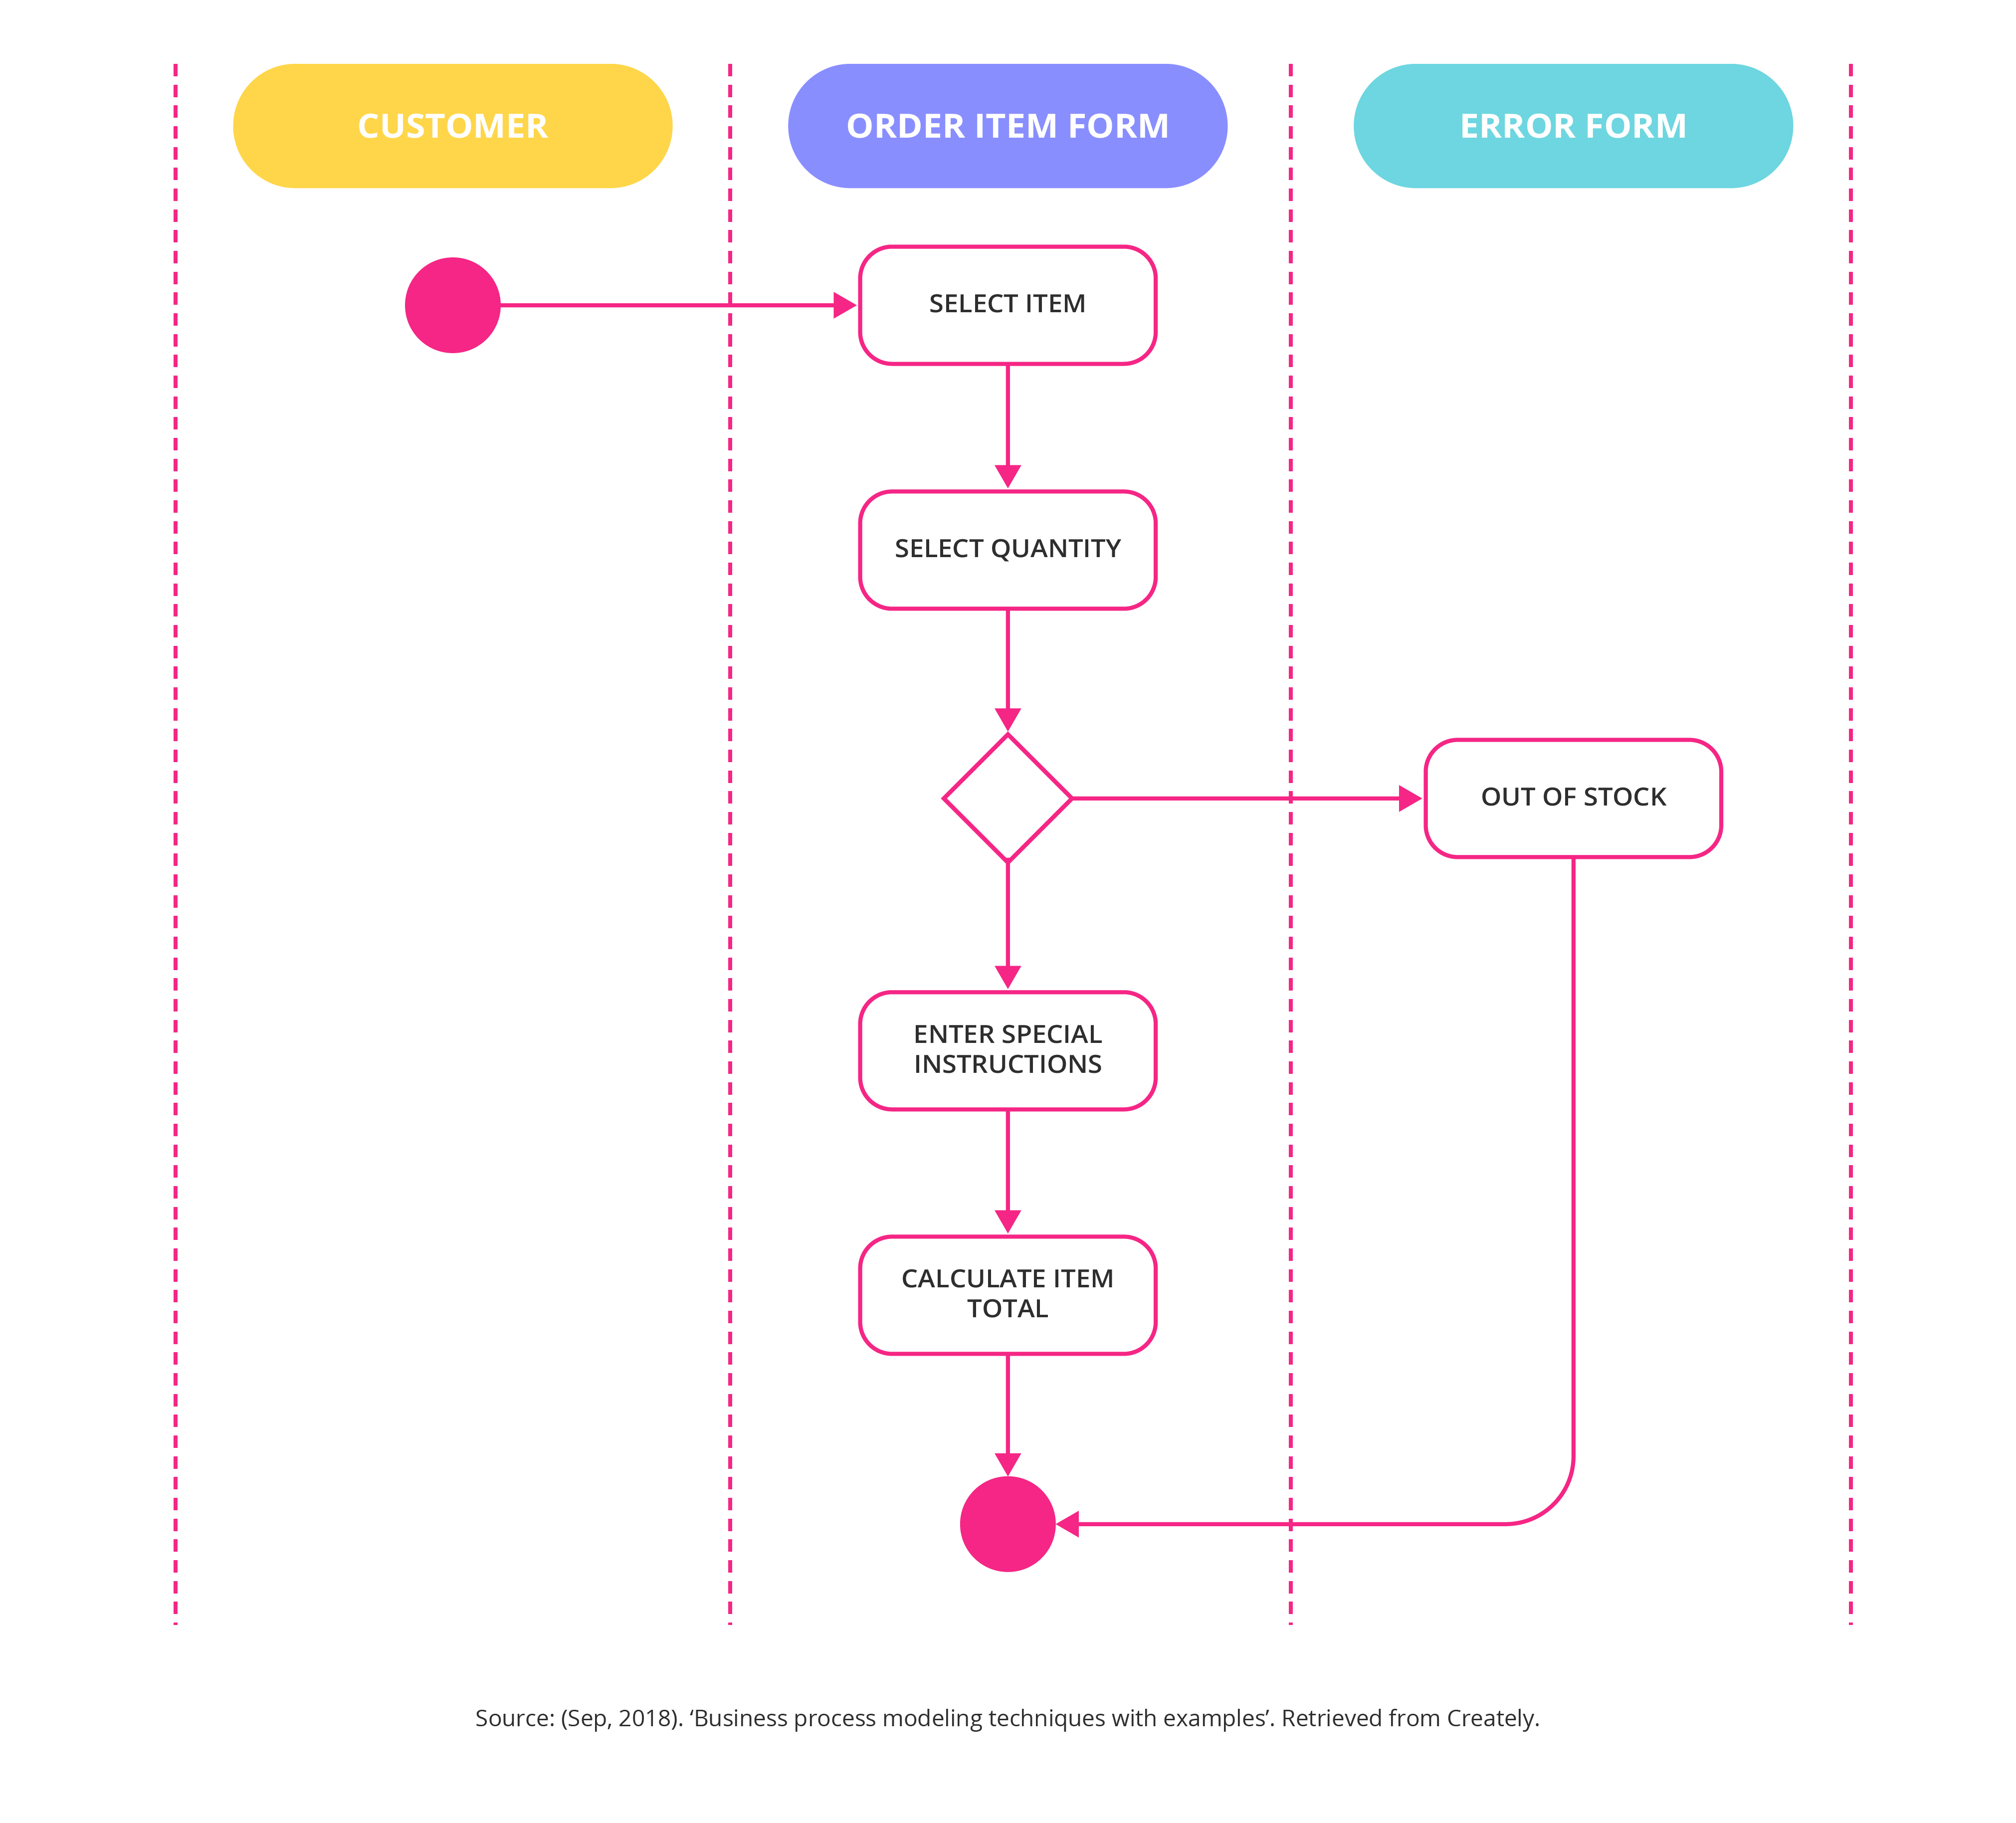
2. Unified modeling language diagrams
Unified modeling language (UML) is a general-purpose approach to visually modeling and documenting processes. UML was initially developed by software developers, but has been successfully used in business process modeling.
It uses 14 types of diagrams to display an object-oriented approach to process visualization. This means that objects are modularized to include things like class, inheritance, and polymorphism. The types of diagrams are split into two categories: behavioral and structural, which display the dynamic and static aspects of a system, respectively.6
Strengths:7
- Popularity among software developers makes it highly recognized and interpretable for teams
- Versatile enough to model processes, applications, and software engineering projects
- Can use tools like LucidChart, Visio, and Draw.io
Limitations:
- Can have a steep learning curve to understand the different diagrams and object types
- Some aspects of the design can lead to ambiguity and different interpretations
- Diagrams can become overly complex for large systems
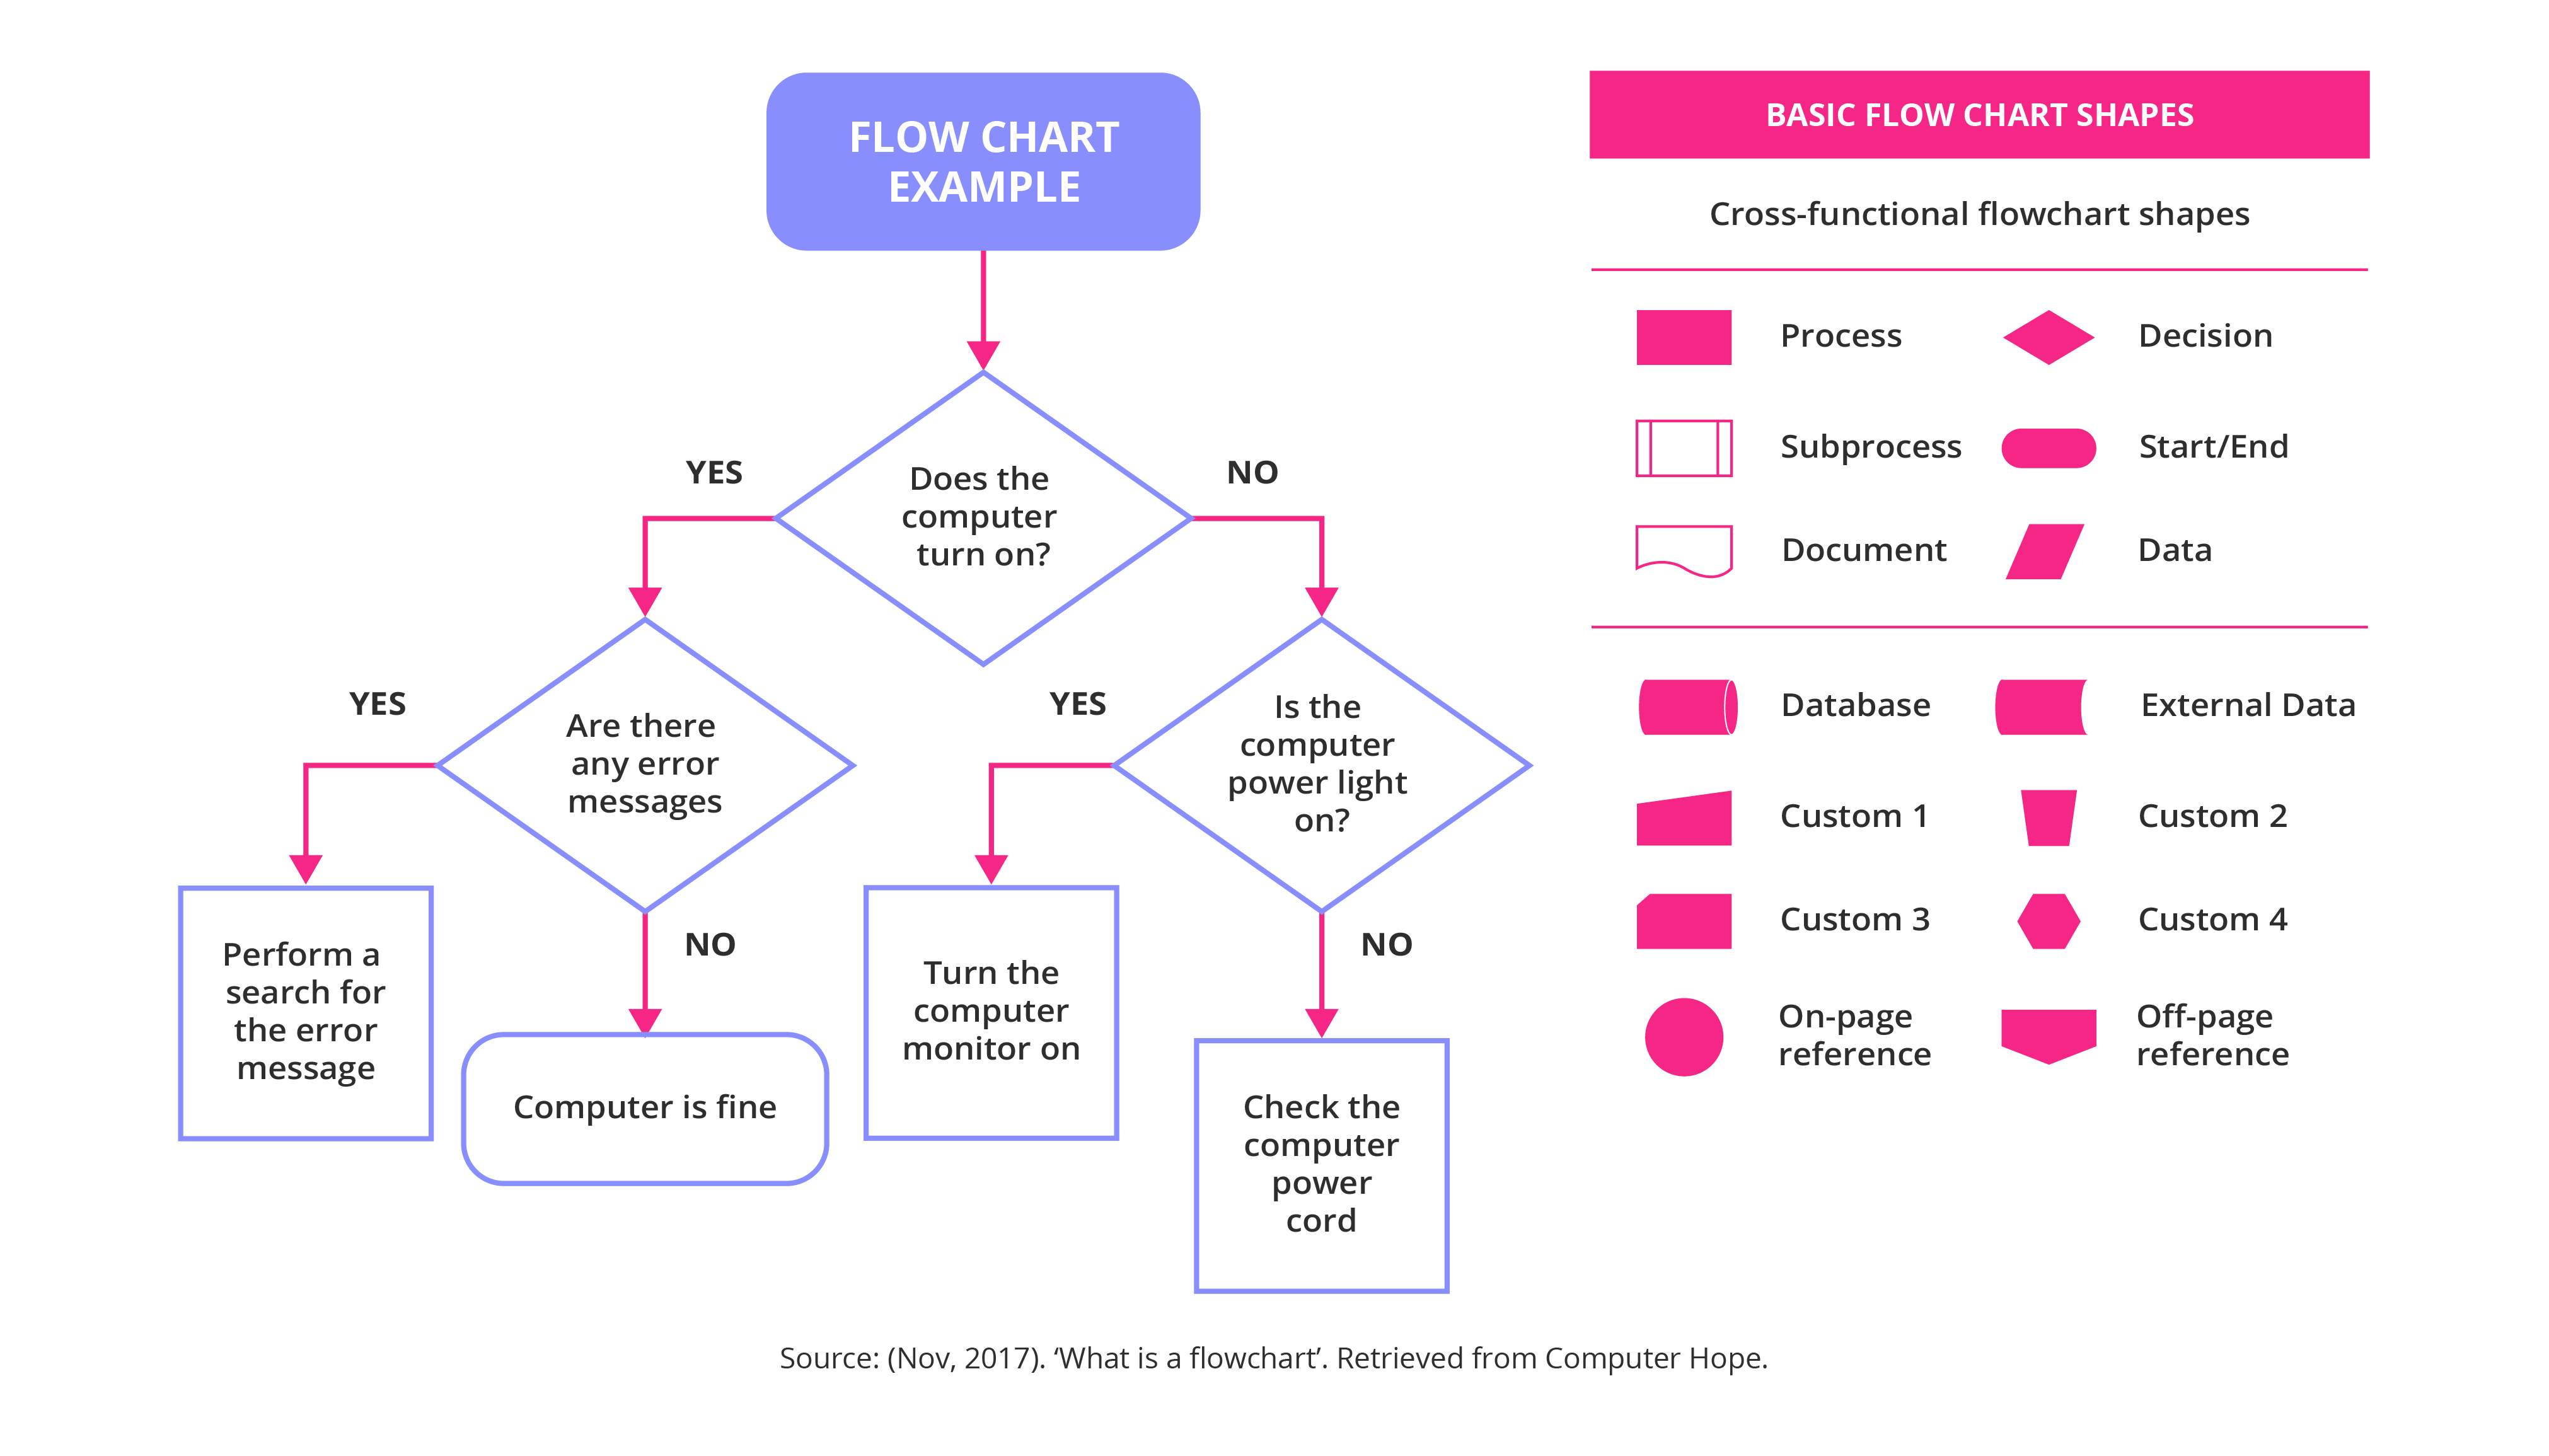
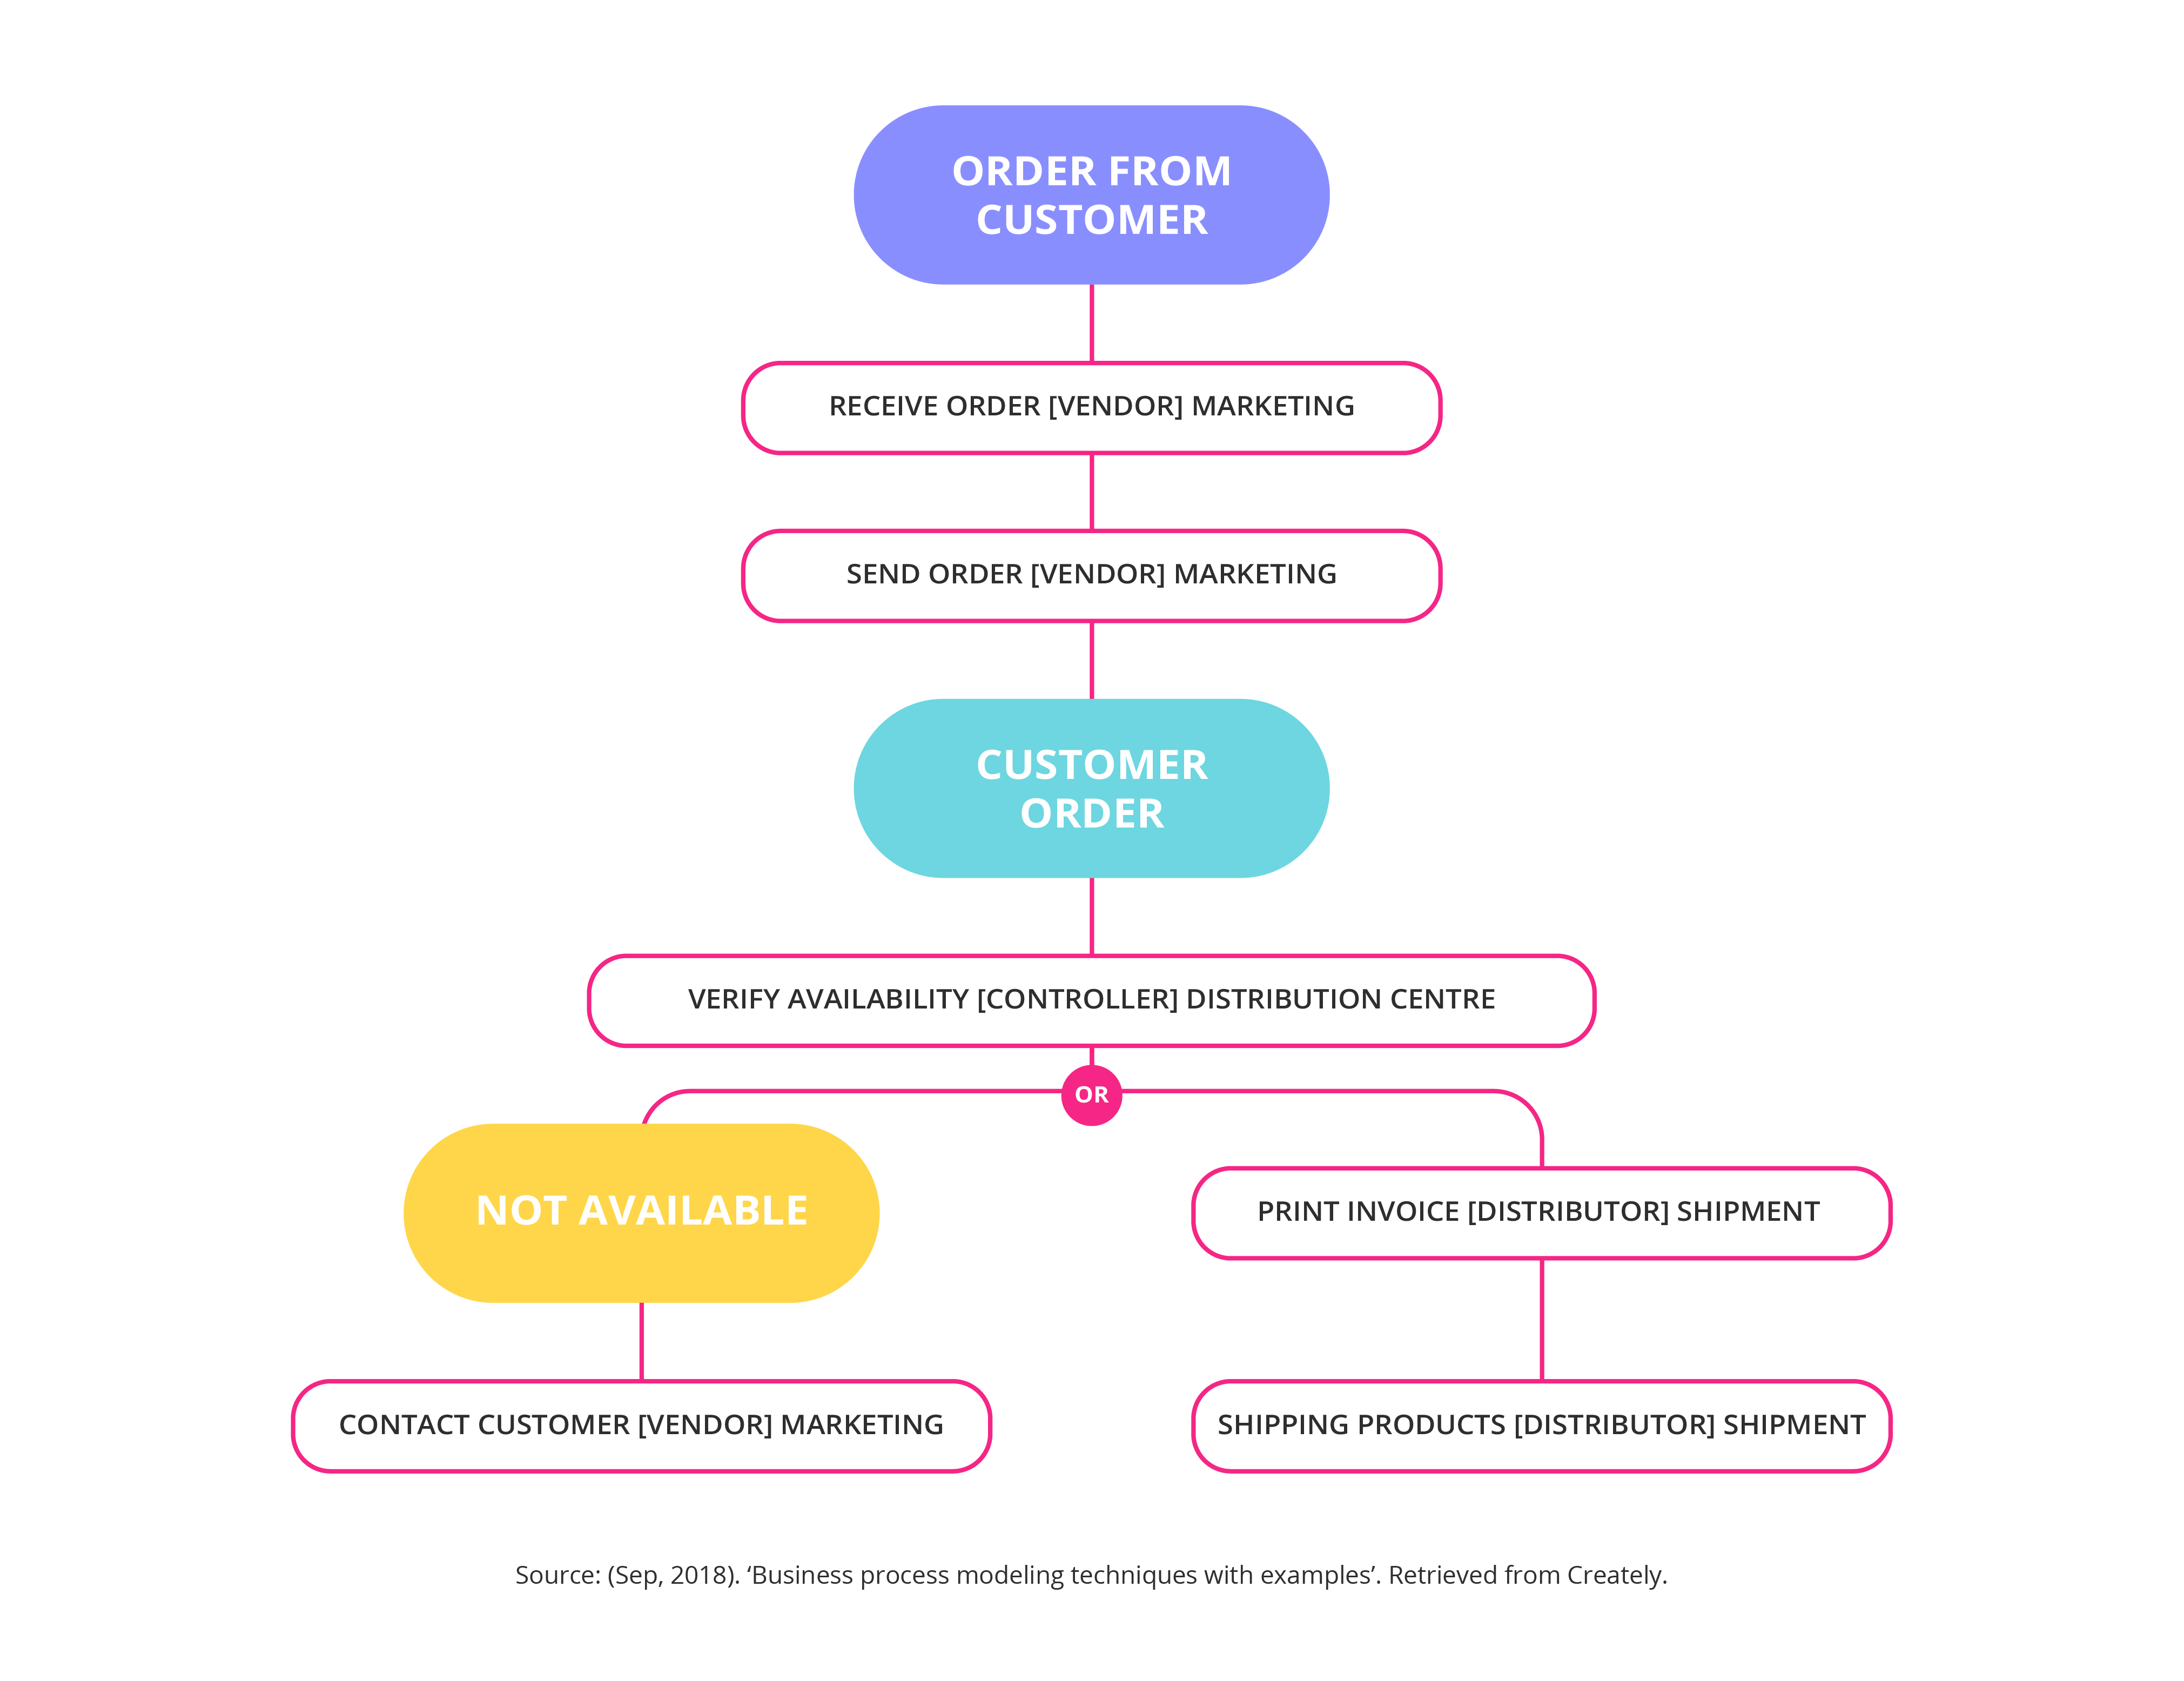
3. Flow chart technique
This is a generic graphic representation of a process, product, or system, which gives people involved in the project a single reference point. Flow charts use basic shapes and arrows to define relationships between steps, decisions, or data.8
Strengths:
- Highly flexible without prescriptive shapes and visual systems
- Intuitive and easy to understand
Limitations:
- Difficult to draw for large and complex processes
- No standard language for general flow charts
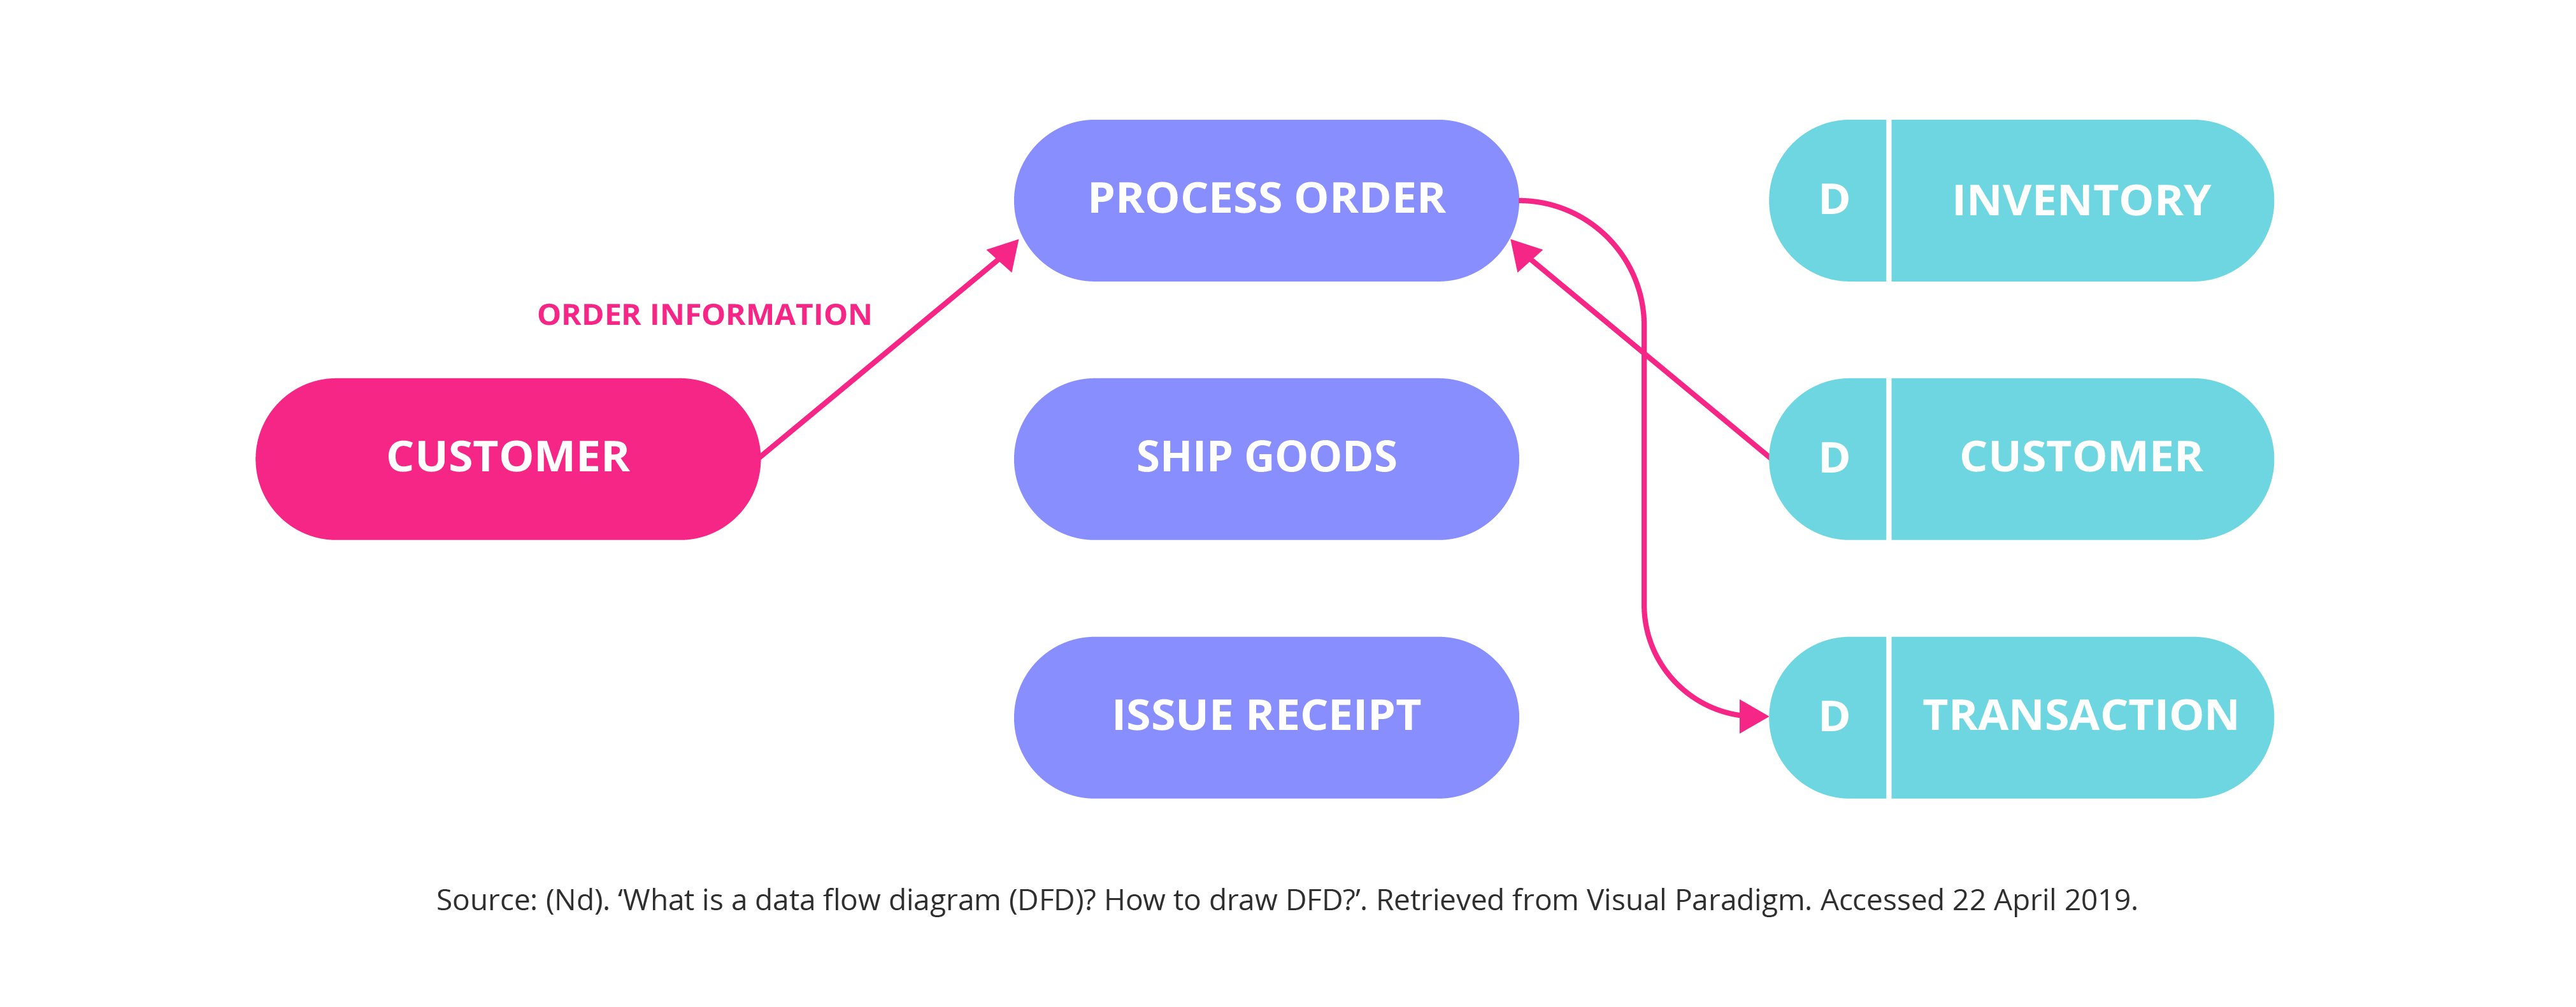
4. Data flow diagrams
Data flow diagrams (DFDs) show the flow of information through a process. Using pre-defined symbols, DFDs visualize data inputs, outputs, storage points, and routes. The symbols generally fall into four types:9
- External entities are represented using squares. These are outside systems that are either the source or destination of data.
- Process is shown using rounded rectangles. These are any steps that change the data and produce an output.
- Data stores are visualized using open-ended rectangles. These are files or repositories that hold information.
- Data flow is represented via arrows. This is the route that data takes between the external entities, process, and data stores.
Strengths:
- Well suited for analysis and modeling data-heavy systems
- Help manage cybersecurity risks
Limitations:
- Less applicable for interactive or real-time software
- Limited scope and does not apply to more general business processes
- Requires technical knowledge of the data flow to create
5. Role activity diagrams
Role activity diagrams (RADs) are used to map out the intangible roles or ideas of behavior that are desired within the company. These can often be functions within the business, systems in IT, or customer and supplier roles.10
Strengths:
- Easy to read and understand
- Provide a different perspective on a process
Limitations:
- Limited to mapping roles and behavior, not all processes
6. Interaction diagrams
A component of UML, interaction diagrams are business process models that graphically illustrate the interaction of various processes with each other within a system. Interaction diagrams come in two forms: sequence diagrams and collaboration diagrams.11
Strengths:
- Helps describe the flow of messages within a system
- Great for illustrating collaborations
- Identify possible connections between lifeline elements
Limitations:
- Not great for a precise definition of certain behaviors
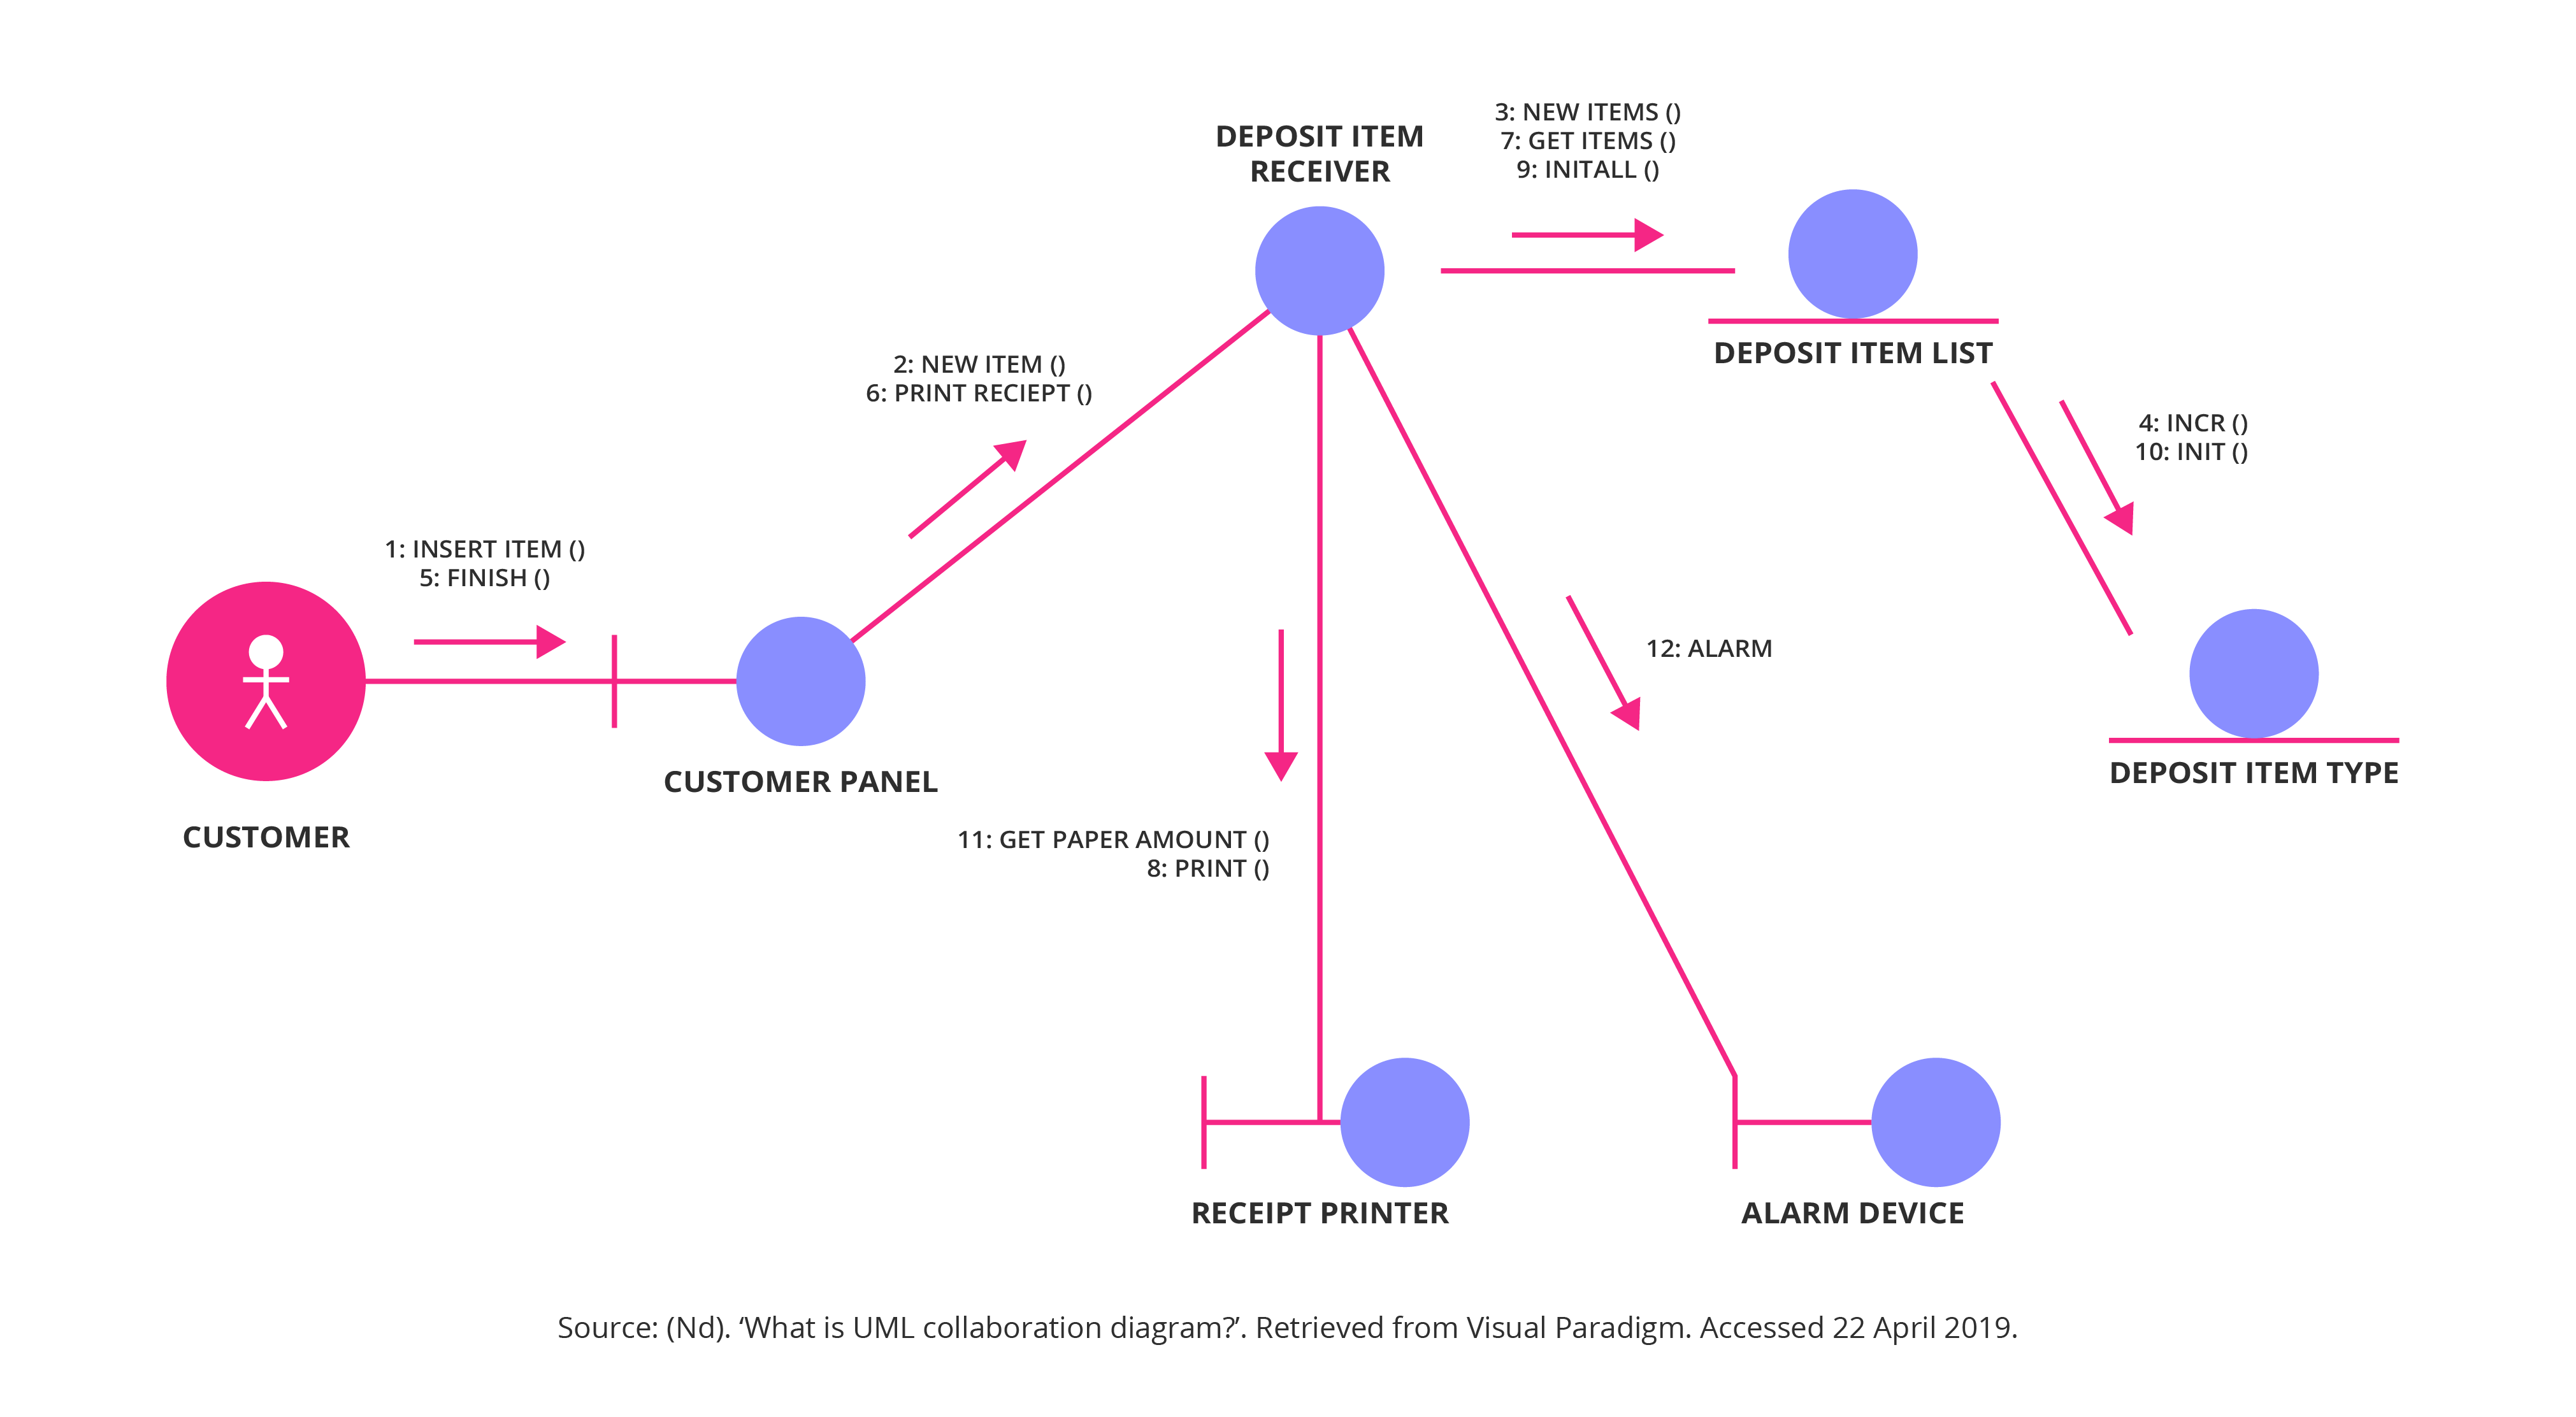
There are two types of interaction diagrams typically used to capture the various aspects of interaction in a system:
- Sequence diagrams. A sequence diagram shows the interaction between objects in the sequence in which they take place. Sequence diagrams describe how the objects function within a system, and in what order, and are often used to document and understand what is required for new and existing systems.
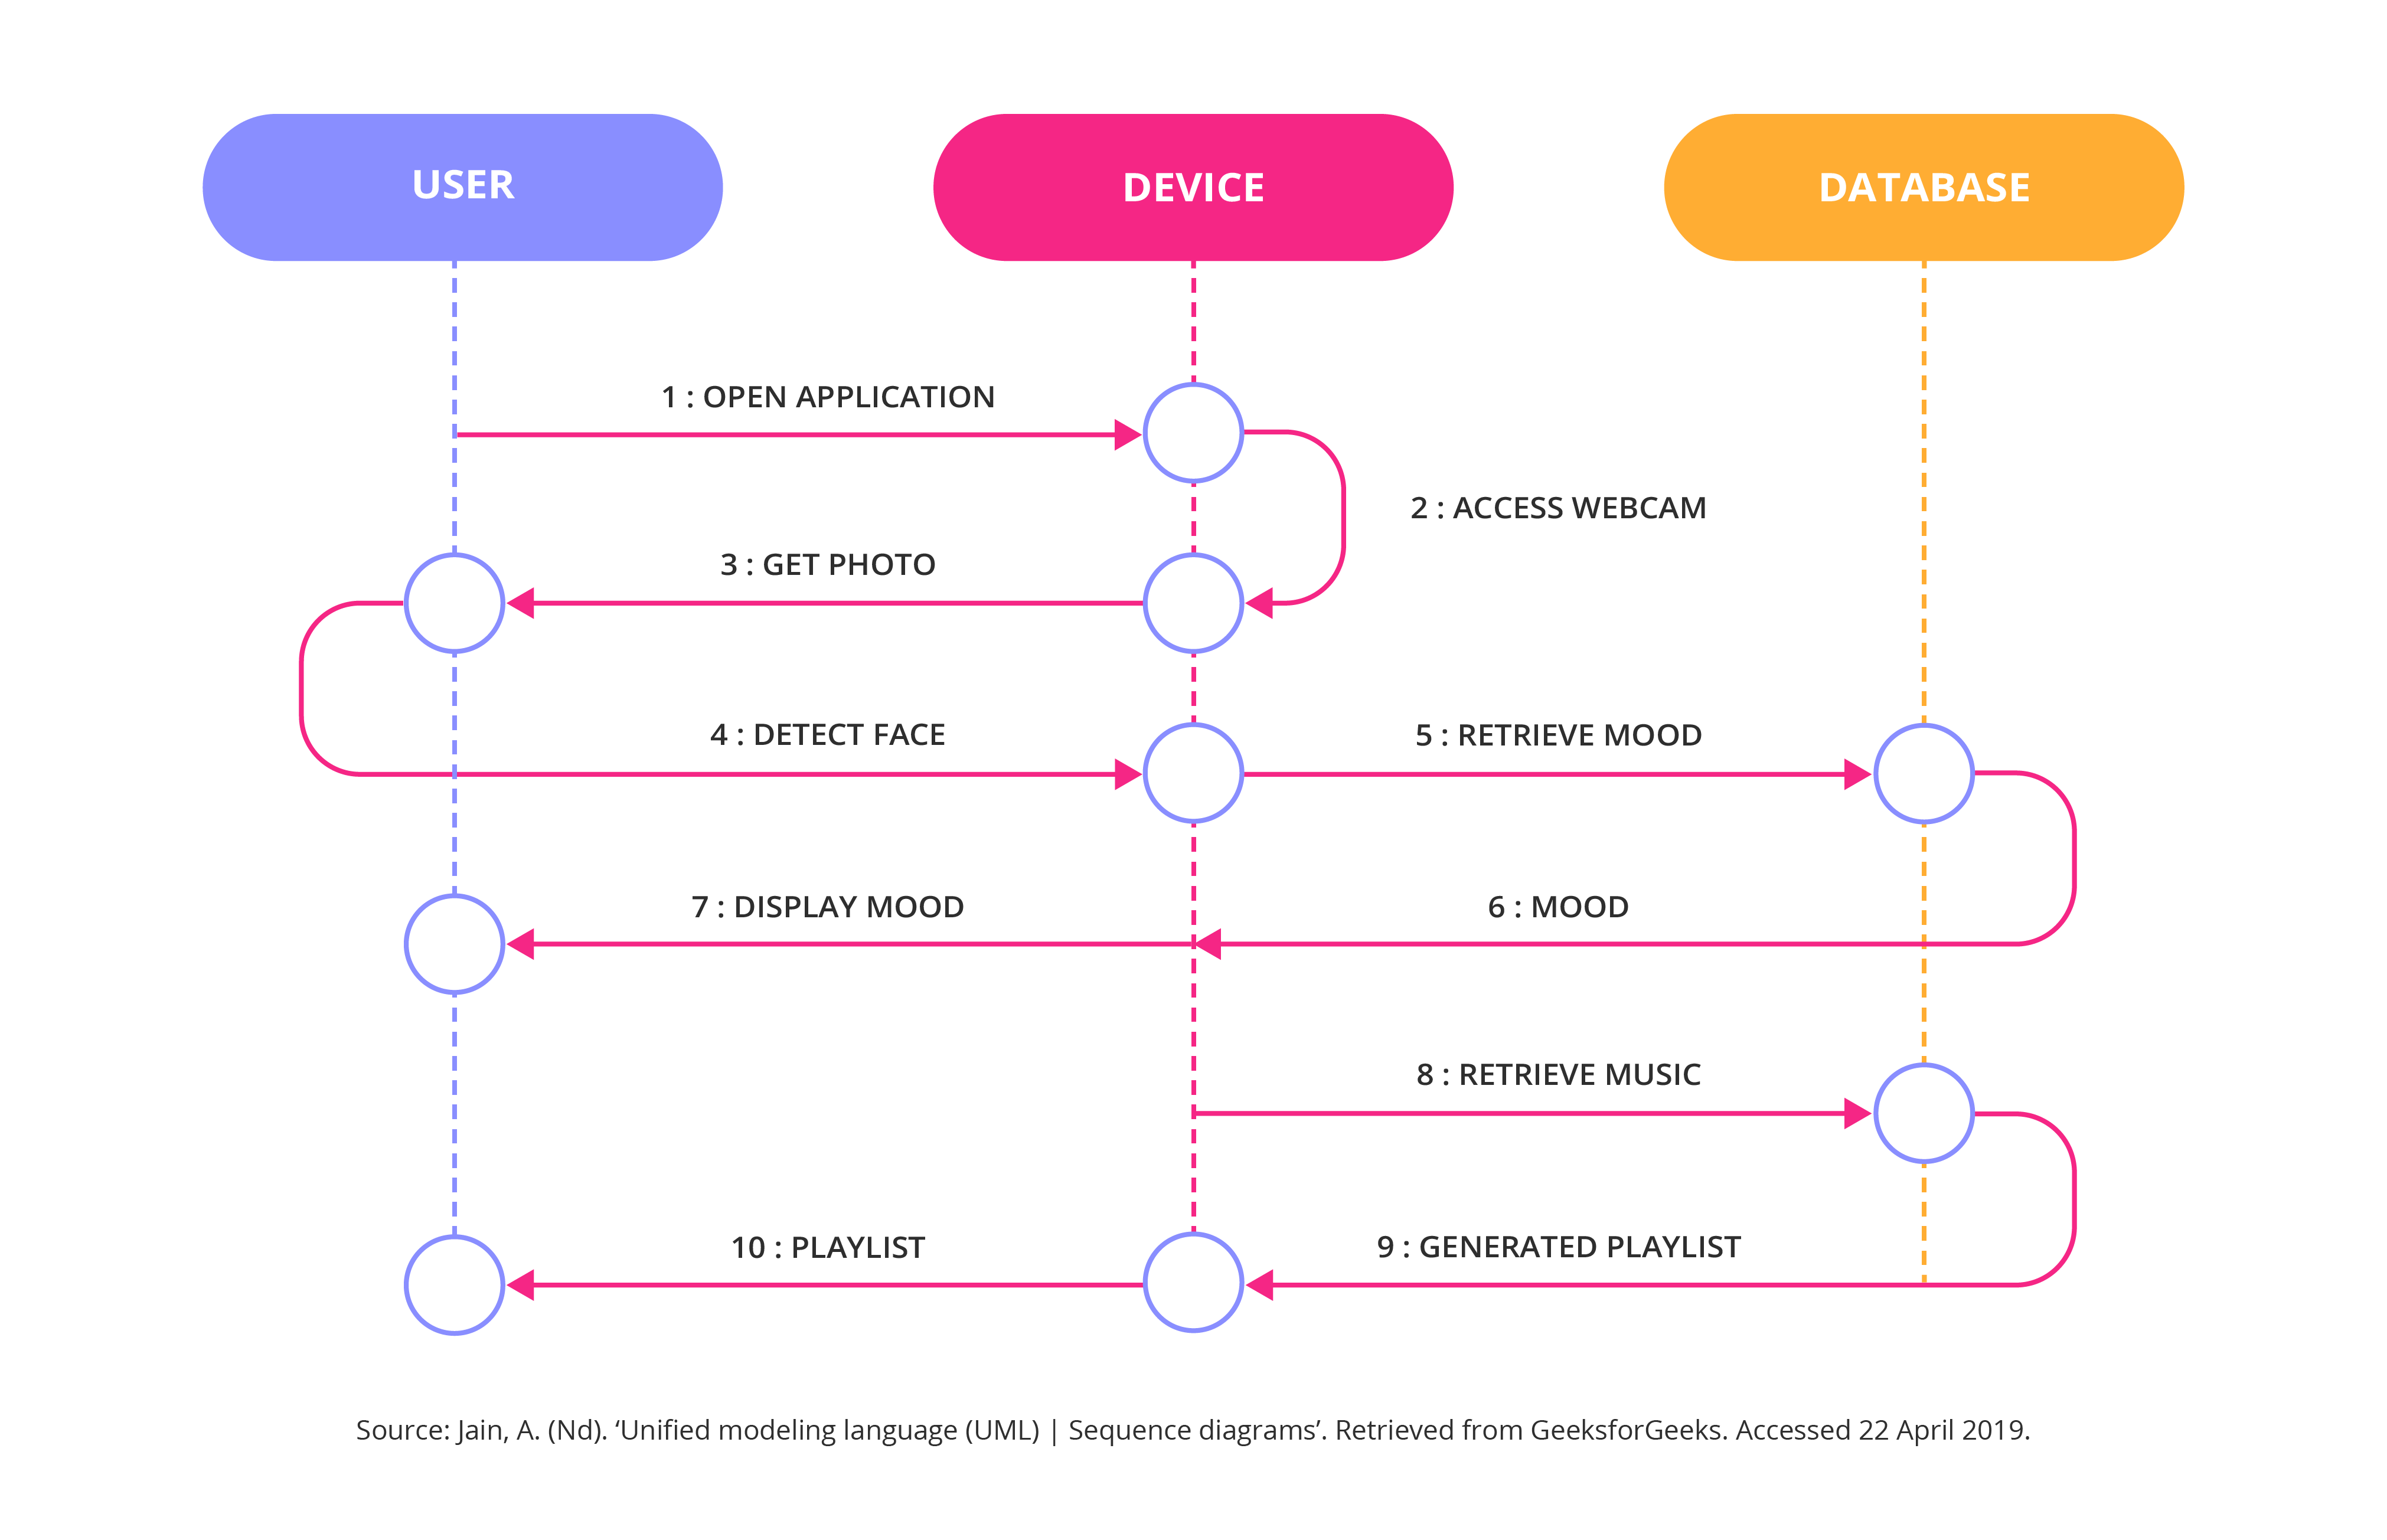
- Collaboration diagram. Collaboration diagrams are used to define and clarify the roles of the objects that carry out a certain flow of events in a visual format, and serve as the main source of information when determining class responsibilities and interfaces.
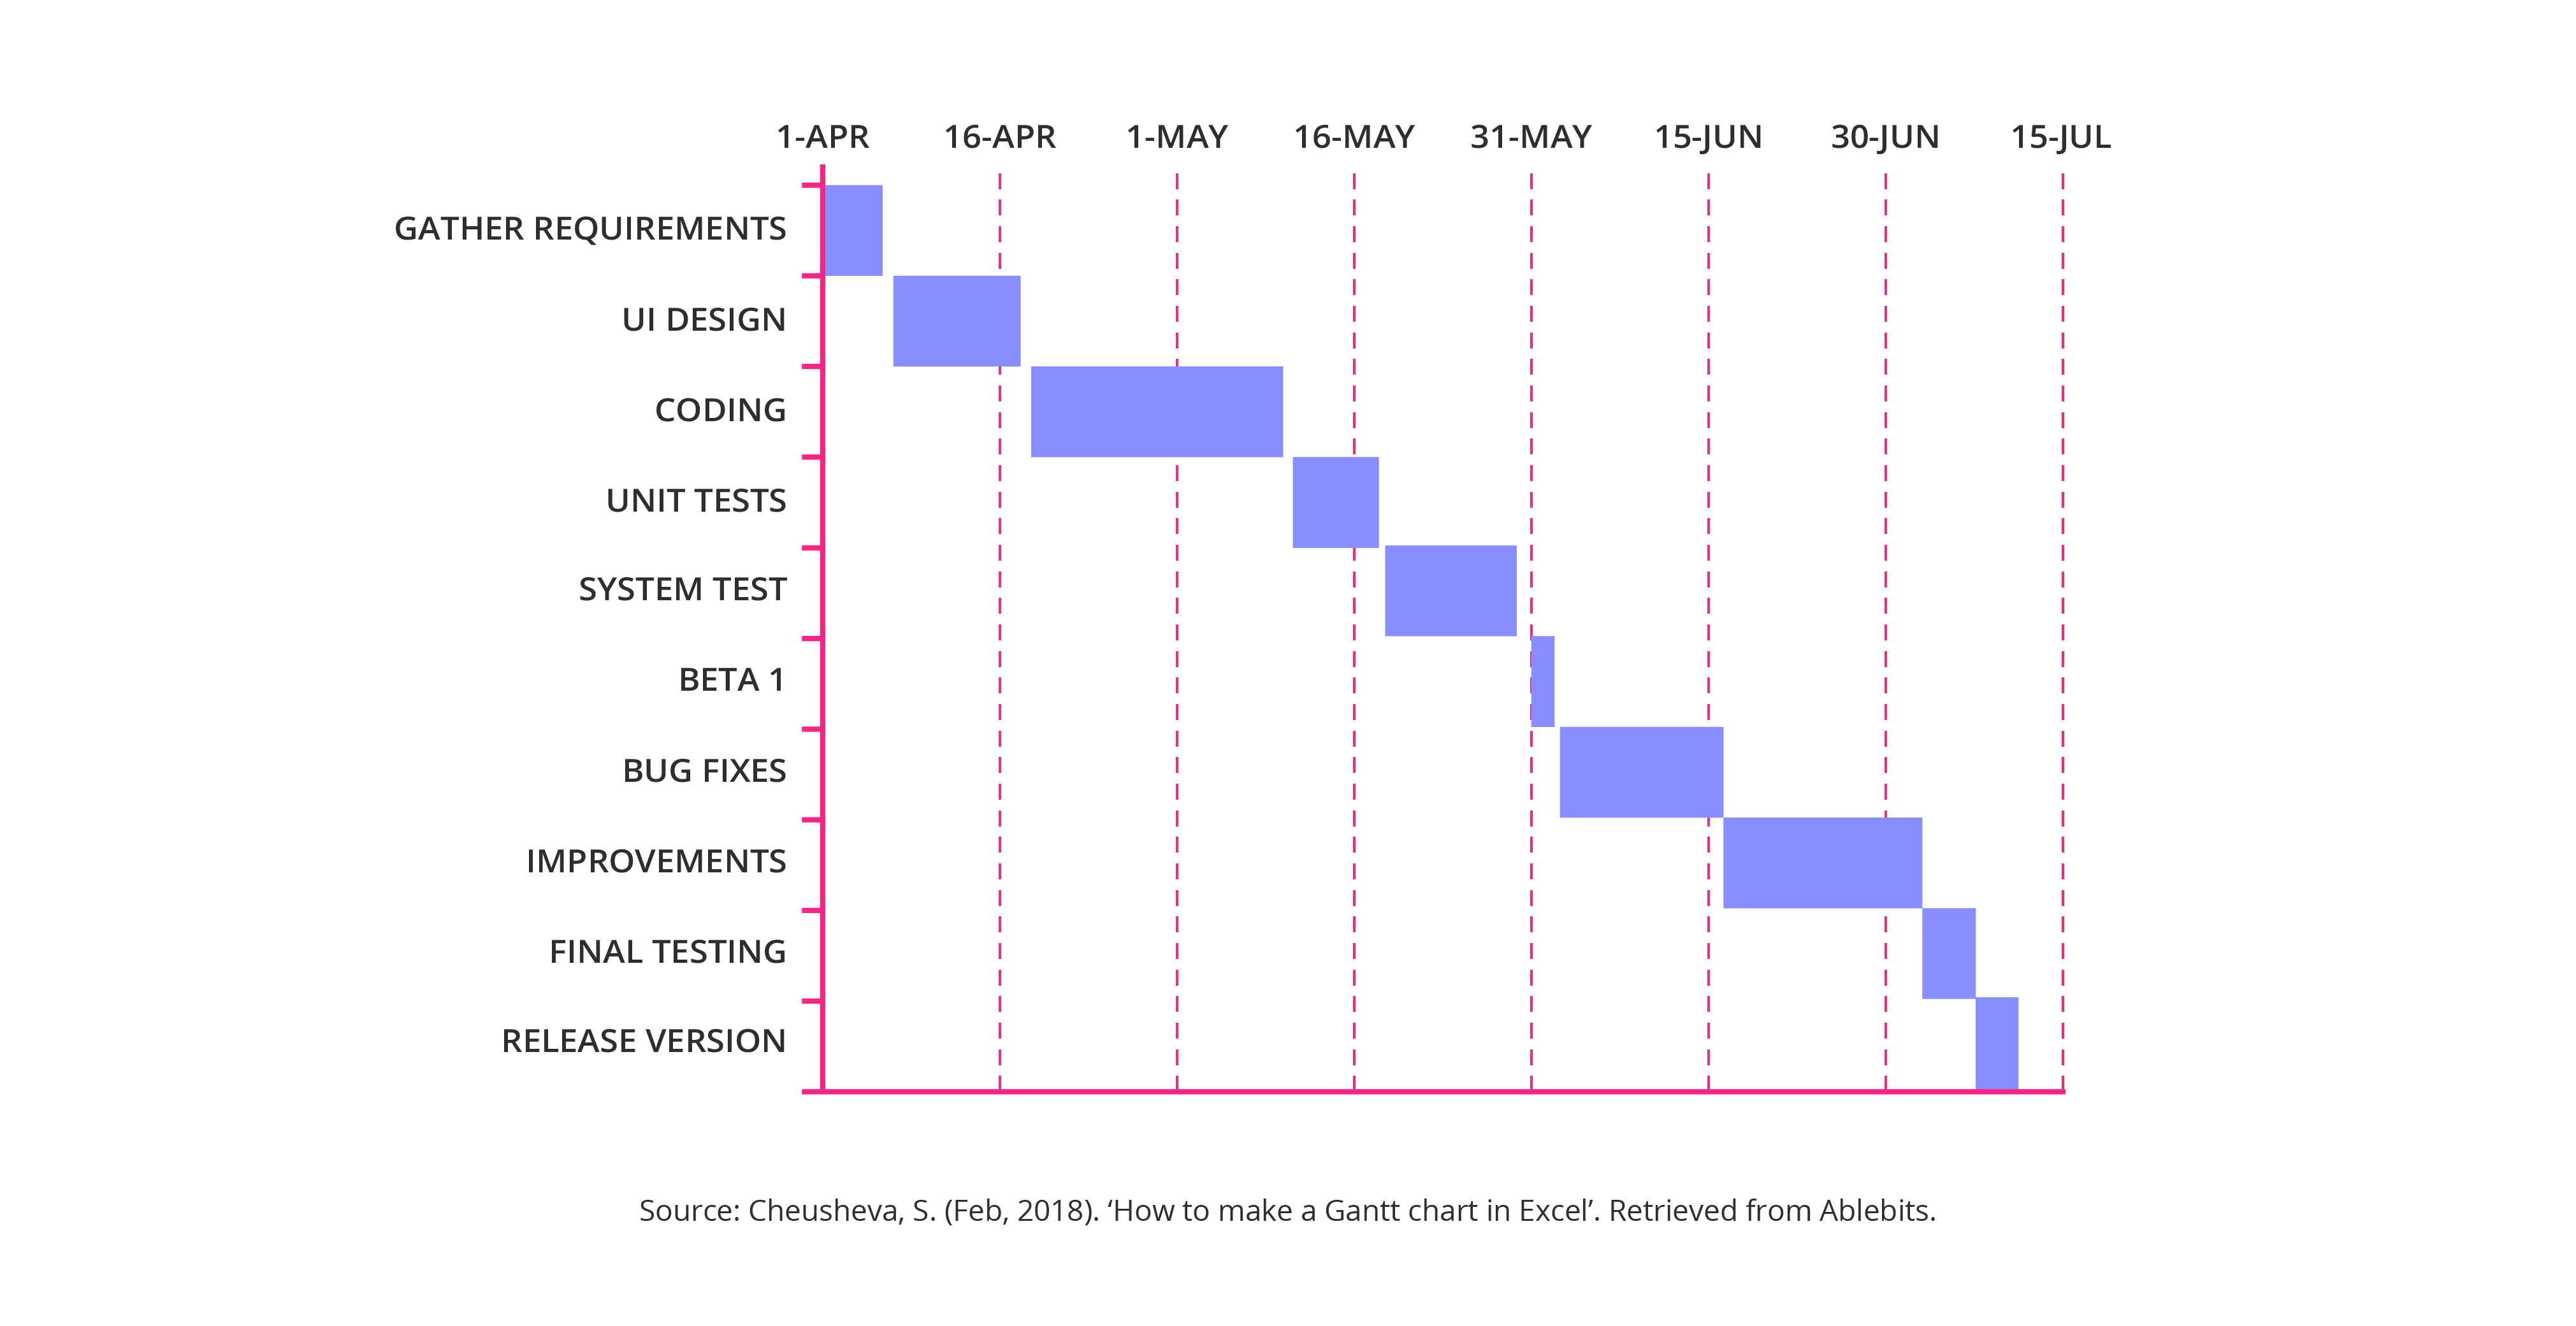
7. Gantt charts
Gantt charts are a popular business process model for companies preparing for projects with distinct timelines, or that have time-sensitive processes that need to be captured and tracked. A Gantt chart plots a vertical list of tasks along a series of aligned, horizontal timelines. Each bar along the timeline represents the anticipated start and end date for a tasks, as well as its current status or progress.12
Strengths:
- Quick overview of who is responsible for each task and when
- Easy for people involved in different parts of a process to see when they are meant to start and finish work
- Visualizes the whole project at once
Limitations:
- Includes little to no details on project scope and finances
- Does not visualize interactions between tasks or the overall shape of a process flow
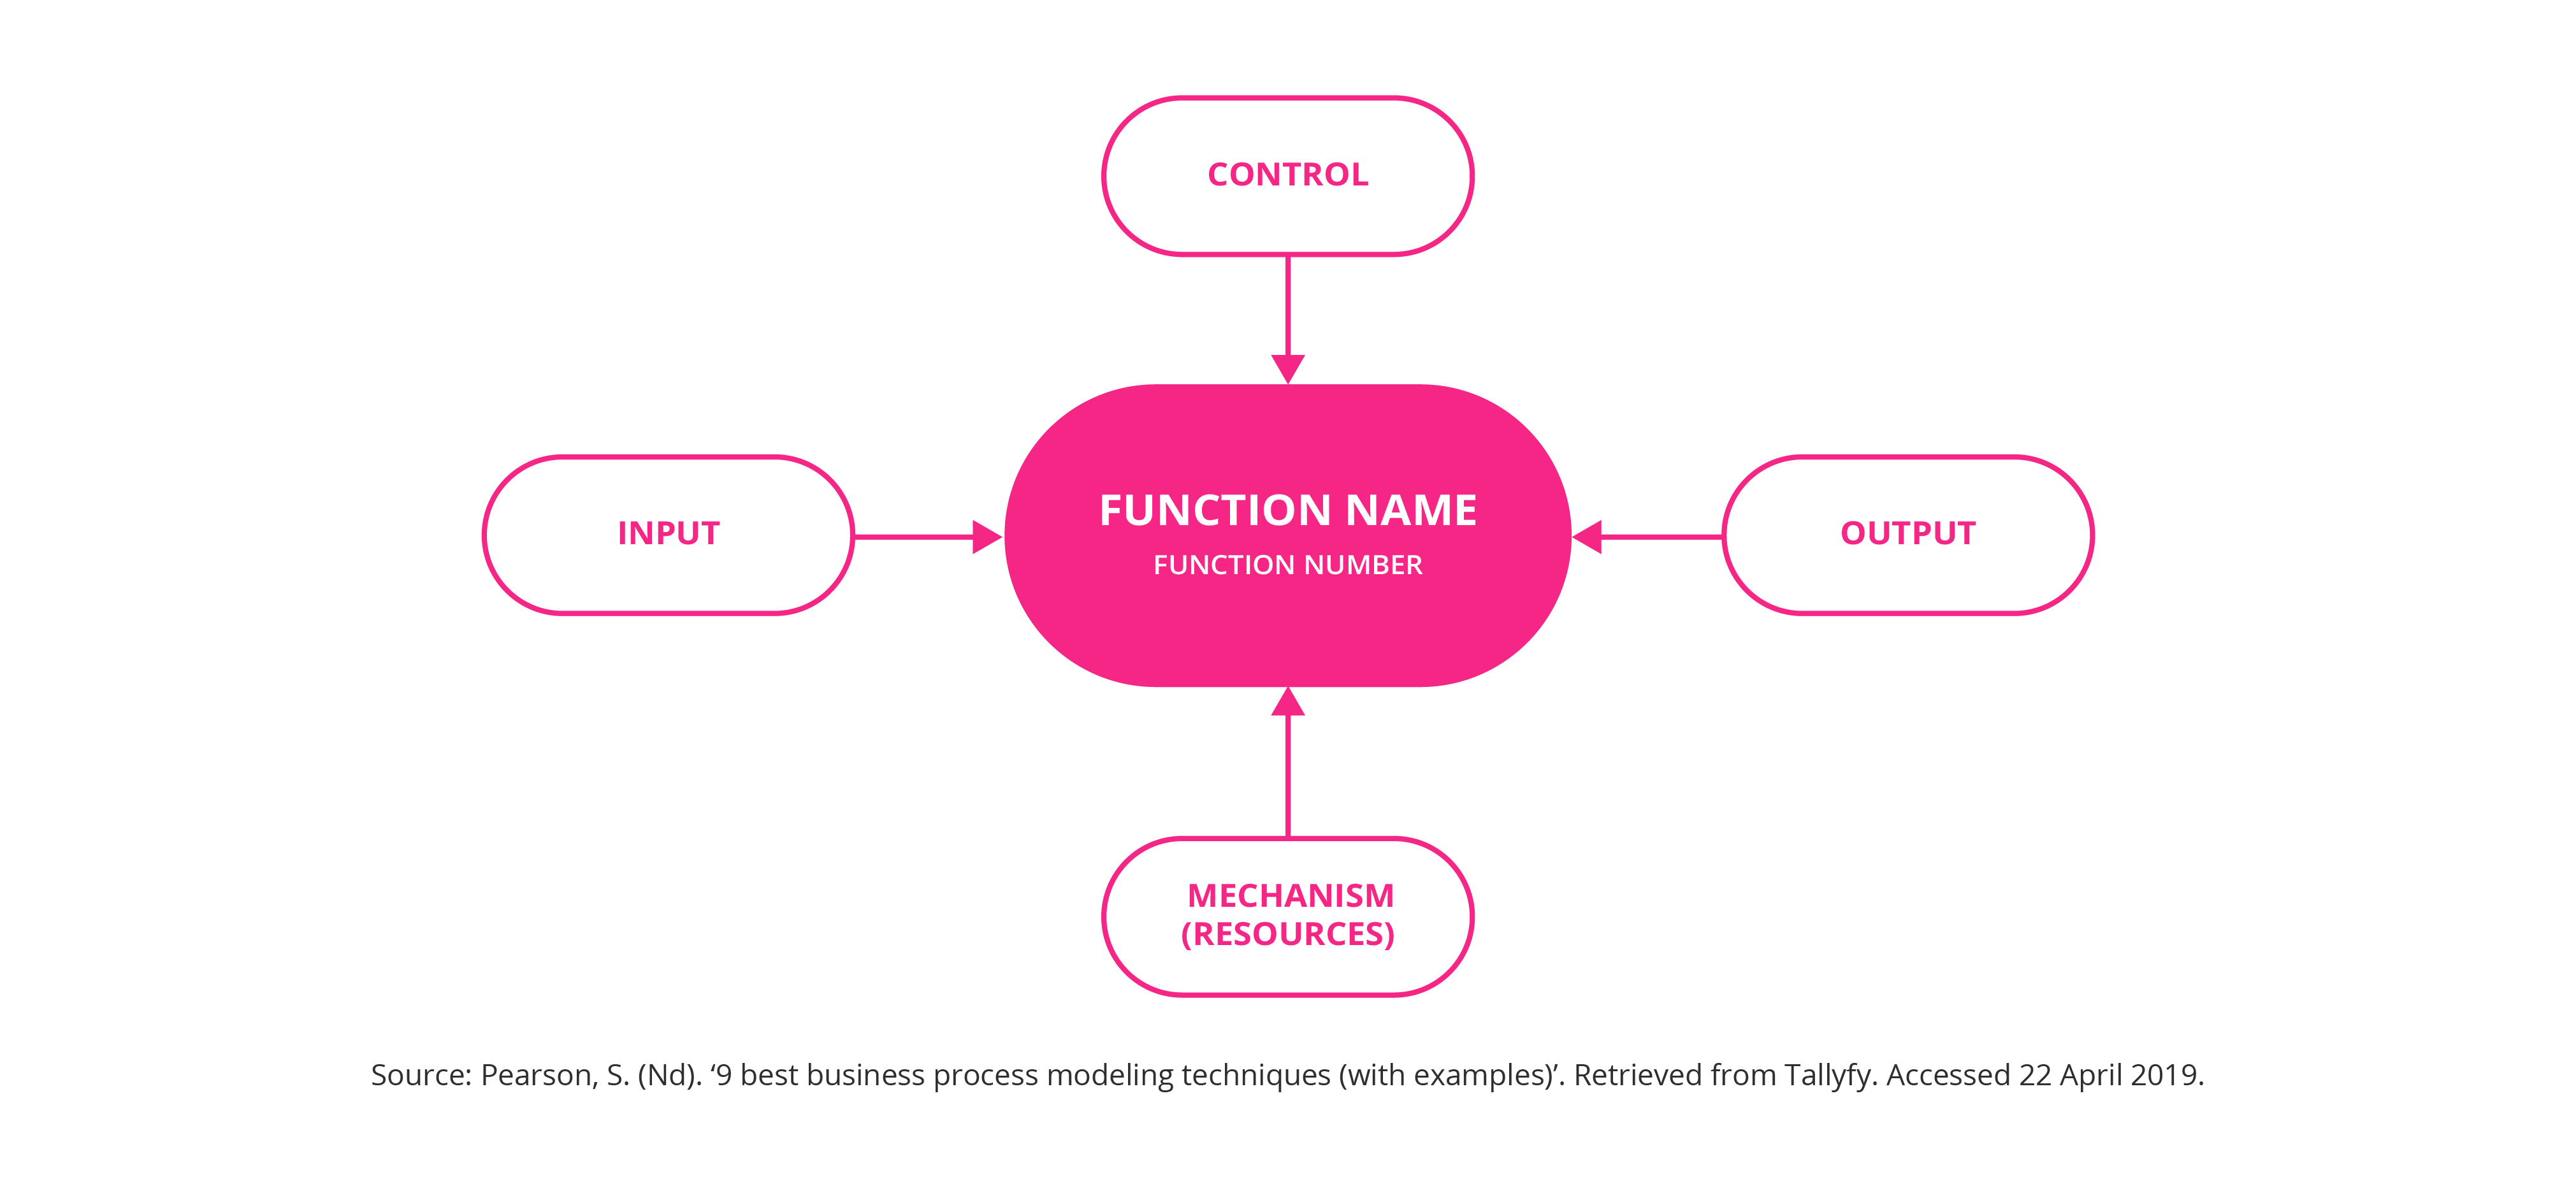
8. Integrated definition for function modeling
Integrated definition (IDEF) for function modelling displays when parent activities give rise to child diagrams. There are 15 forms of IDEF and each addresses a different type of flow for functions, information, data, simulation model design, process description capture, and so on.13
Strengths:
- Easy to understand, even without technical knowledge
- Useful for defining the scope of analysis
Limitations:
- Framework is very rigid to each use case
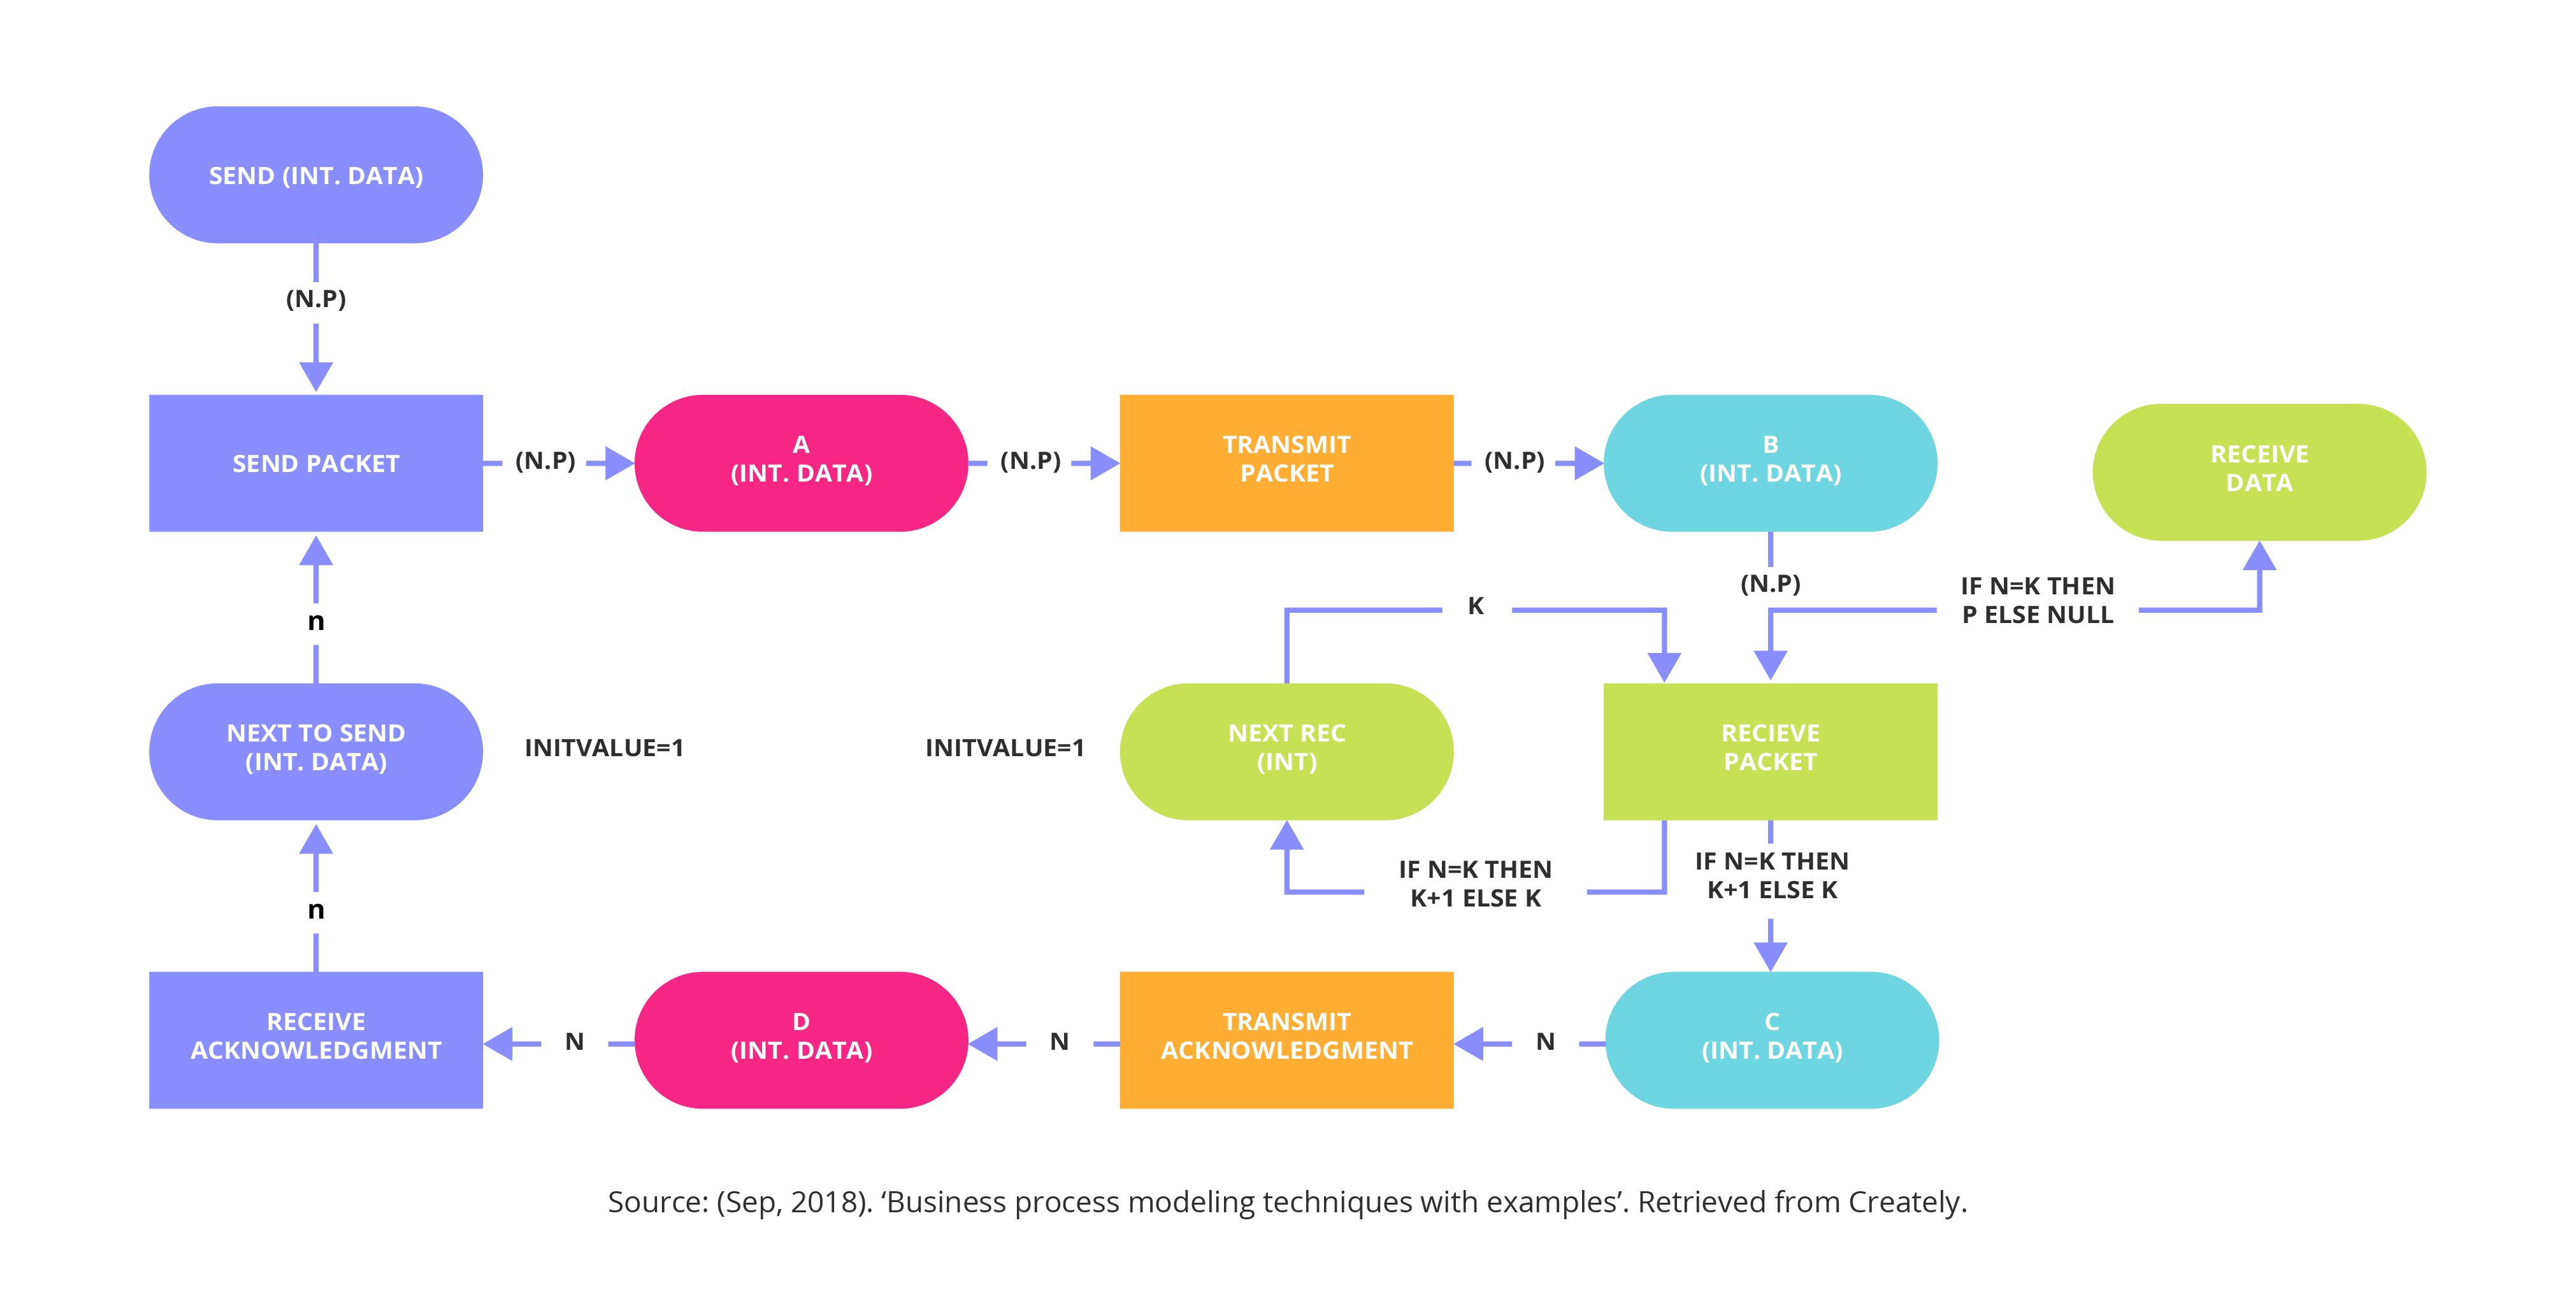
9. Colored Petri nets
When a system has numerous processes that interact and synchronise with each other, then colored Petri nets are ideal. This modeling technique is used to design, specify, simulate, and verify systems.14
Petri nets are unique in that they can represent both a state, such as passive, unsent, or waiting, and an action, such as send, receive, or transmit, in the same diagram. Colored nets use colors to differentiate their symbols, and use a formal, mathematical representation with well-defined syntax and semantics.
Strengths:
- Mathematical foundations make it suitable for rigorous analysis
- Works well for concurrent activities
Limitations:
- Complexity can be difficult for beginners
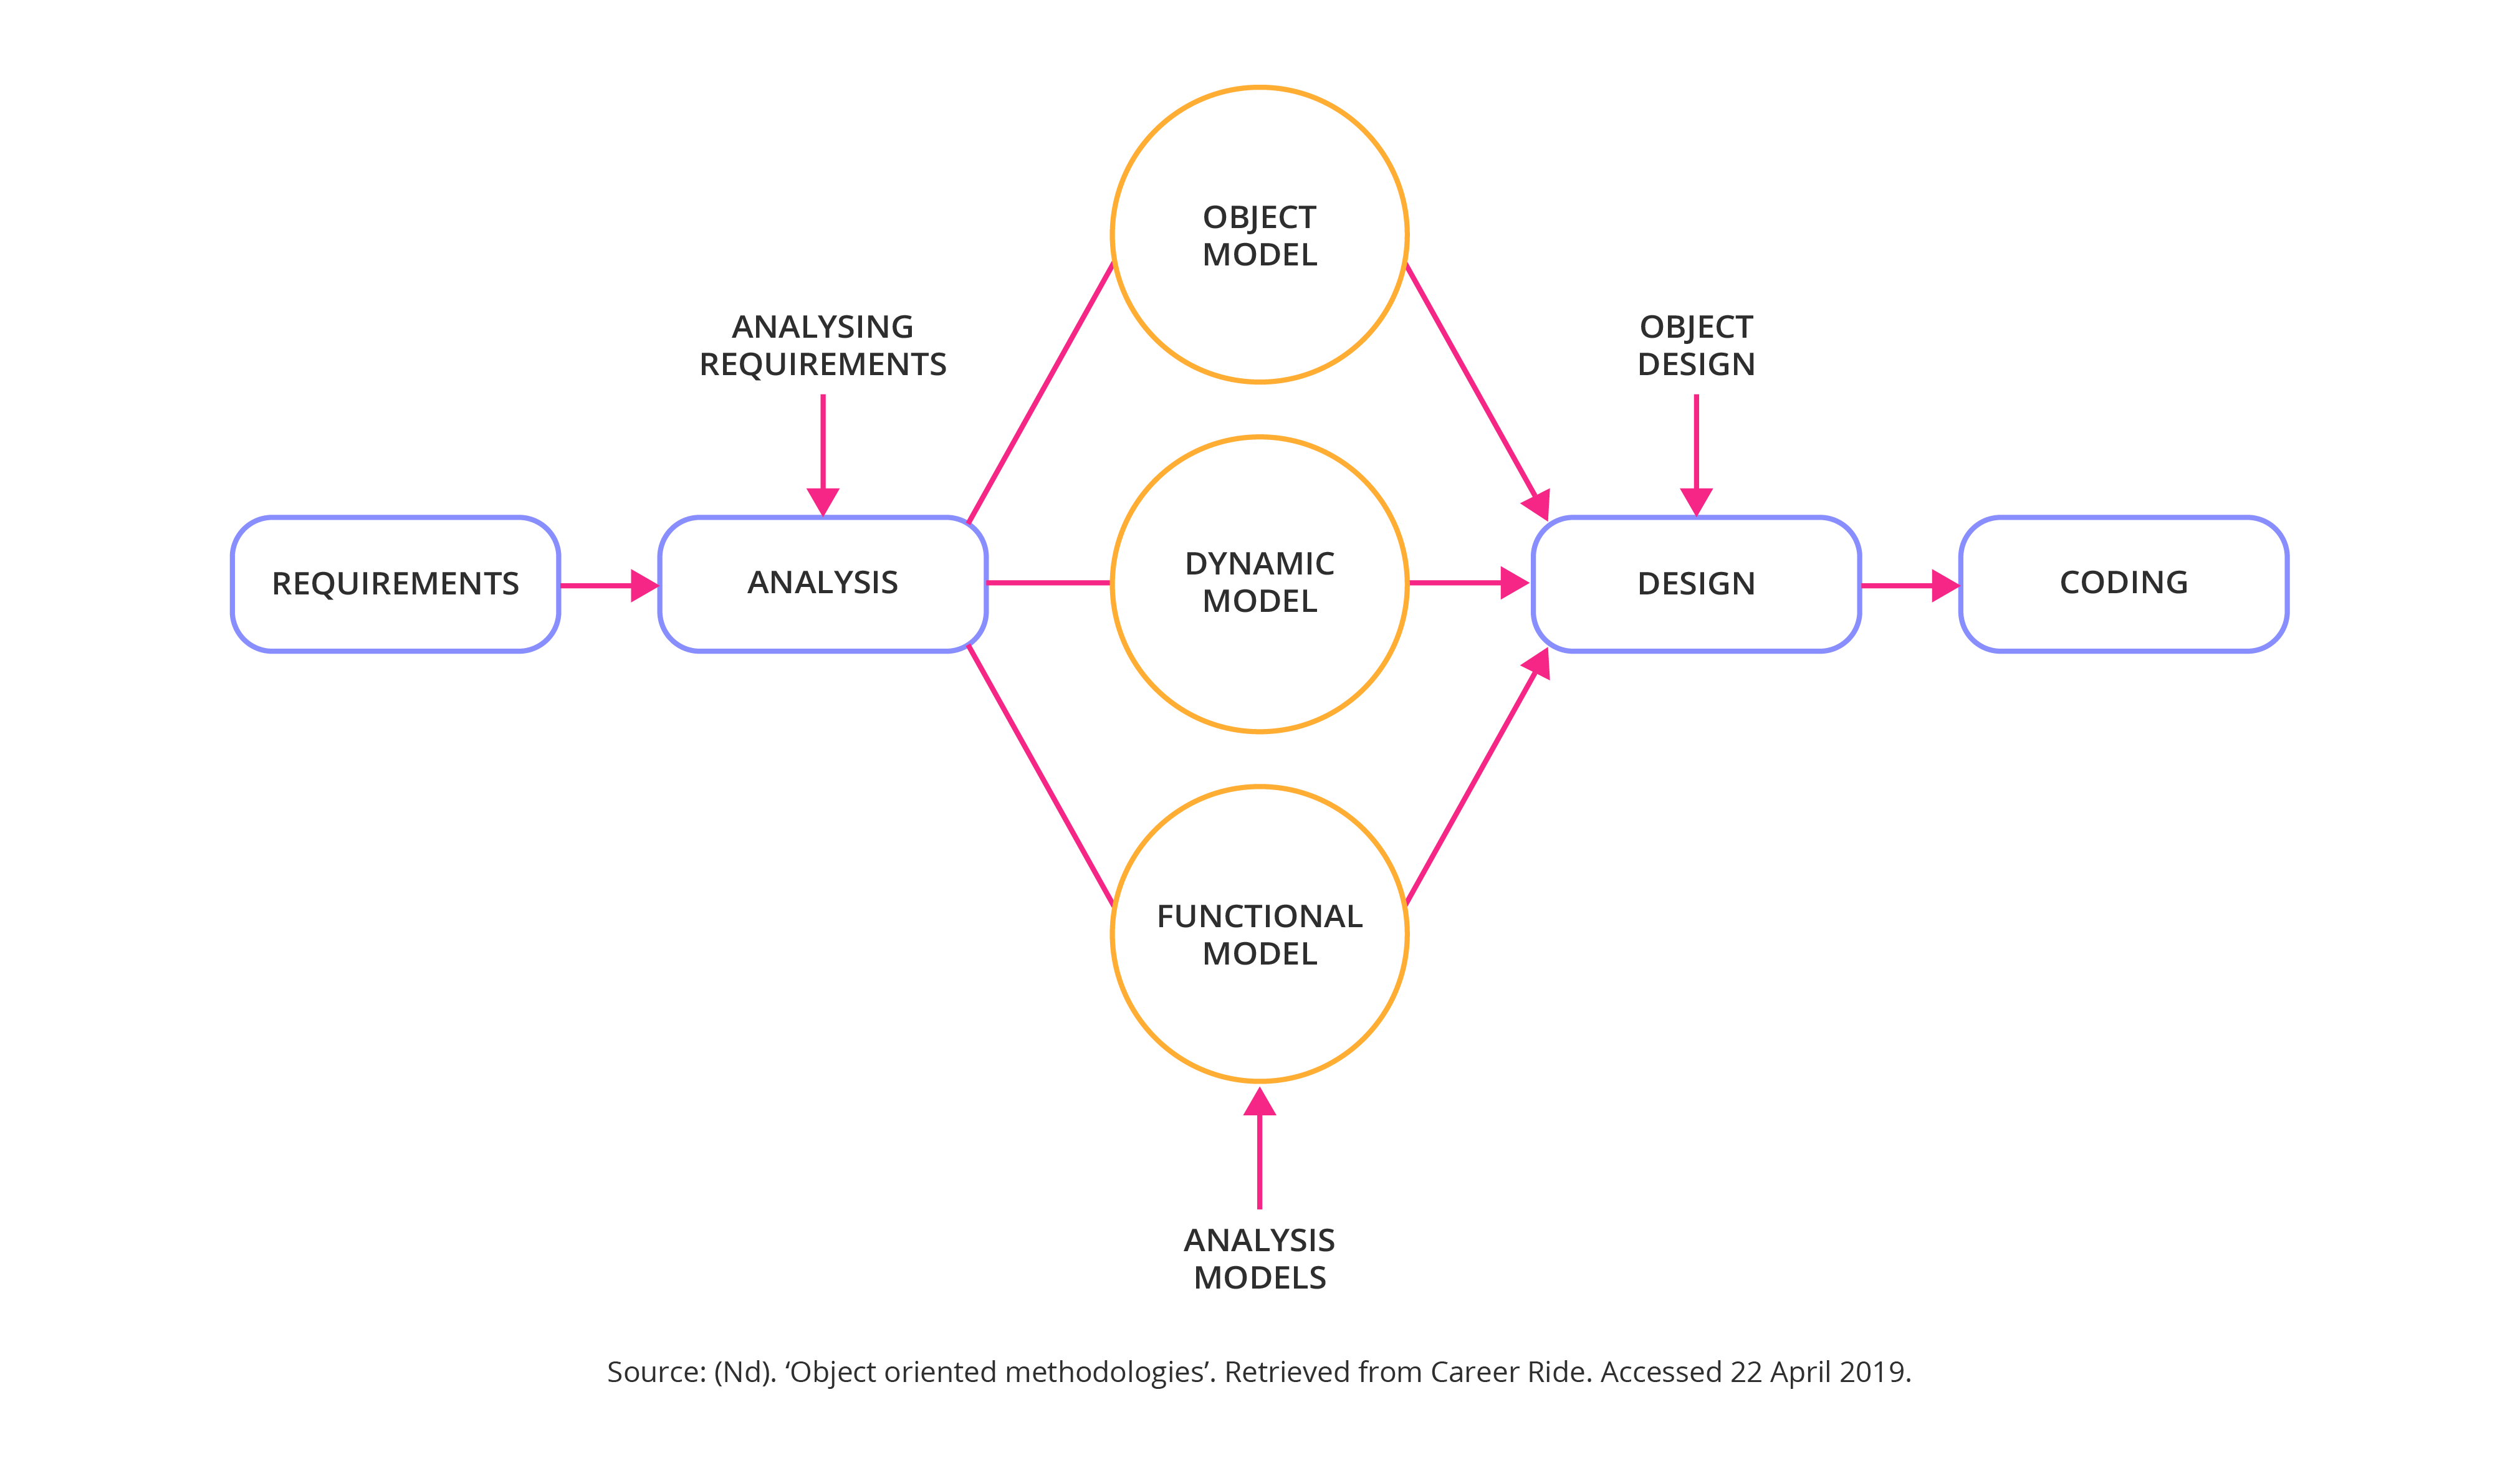
10. Object-oriented methods
The object-oriented method of business process modeling is more than just modeling with objects: it encompasses message-passing, encapsulation (where internal detail is hidden), inheritance from class to subclass, and polymorphism (where the same procedure can operate on different data types).15
Strengths:
- Modular structure promotes ease-of-use
- Features like inheritance make reusability easier
Limitations:
- More applicable for software development processes than general business processes
Think more strategically about your business process designs
Which business process modeling technique will you select for your business? Find the one that will ensure those involved in the system or process carry out their tasks in a consistent and efficient way, producing a predictable, measurable outcome.
Register now and join one of our project management courses or business management courses to learn more about the different types of process modeling available to your business.

- 1 (2014). ‘About the Business Process Model and Notation specification version 2.0.2’. Retrieved from Object Management Group Standards Development Organization.
- 2 Stryker, C. & Belcic, I. (Jun, 2024). ‘What is Business Process Modeling and Notation (BPMN)?’. Retrieved from IBM.
- 3 Magalhães, H. (Dec, 2023). ‘What are the advantages and disadvantages of choosing BPMN instead of a traditional flowchart?’. Retrieved from Helppier.
- 4 (2013). ‘Business Process Model and Notation (BPMN)’. Retrieved from Object Management Group.
- 5 Stachecki, F. (Feb, 2024). ‘Can BPMN Artifacts make your process models more understandable?’. Retrieved from EduMAX.
- 6 (Jan, 2025). ‘Unified Modeling Language (UML) diagrams’. Retrieved from GeeksforGeeks.
- 7 (Dec, 2022). ‘Why the software industry has a love-hate relationship with UML diagrams’. Retrieved from Creately.
- 8 (Nd). ‘What is a flowchart?’. Retrieved from ASQ. Accessed June 20, 2025.
- 9 (Nd). ‘What is a data flow diagram?’. Retrieved from LucidChart. Accessed June 20, 2025.
- 10 Clayton, M. (Aug, 2024). ‘What are Role-Activity Diagrams? (RADs) – aka Swimlane Process Diagrams’. Retrieved from YouTube.
- 11 (Nd). ‘All about UML interaction diagrams’. Retrieved from LucidChart. Accessed June 23, 2025.
- 12 (Oct, 2024). ‘Creating a Gantt chart: How-tos, templates, and tips’. Retrieved from Canva.
- 13 (Nd). ‘The complete guide to understand IDEF diagram’. Retrieved from EdrawMax. Accessed June 23, 2025.
- 14 (2019). ‘Petri Net Model’. Retrieved from ScienceDirect.
- 15 (Jul, 2022). ‘Types of models in object oriented modeling and design’. Retrieved from GeeksforGeeks.