 Read time: 8 mins


Big data analytics techniques and types
The global big data market revenues for software and services are expected to increase from $327 billion in 2023 to $862 billion by 2030.1 Every day, 402 million terabytes of data are created — the majority of the world’s data has been created in the last few years alone.2
The world is driven by data, and it’s being analyzed every second, whether it’s through your mobile GPS, your Netflix habits, or the items sitting in your online shopping cart. Every business sector looks to data for market insights and ultimately, to generate growth and revenue.
Choosing the right type of data analysis for your task, and the techniques and tools to go with it, is an important step. Keep reading to learn more about how data analytics is used to take massive amounts of information and make predictions and decisions.
Key takeaways
- The amount of data being generated is growing at an unprecedented rate, with 90% of the world’s data being created in just the last few years.
- There are four main types of data analysis — descriptive, diagnostic, predictive, and prescriptive — each serving a unique purpose, from understanding what happened in the past to recommending a course of action for the future.
- There are a variety of techniques to help you accomplish data analysis techniques, from data visualization and A/B testing, to machine learning tactics like NLP and decision trees.
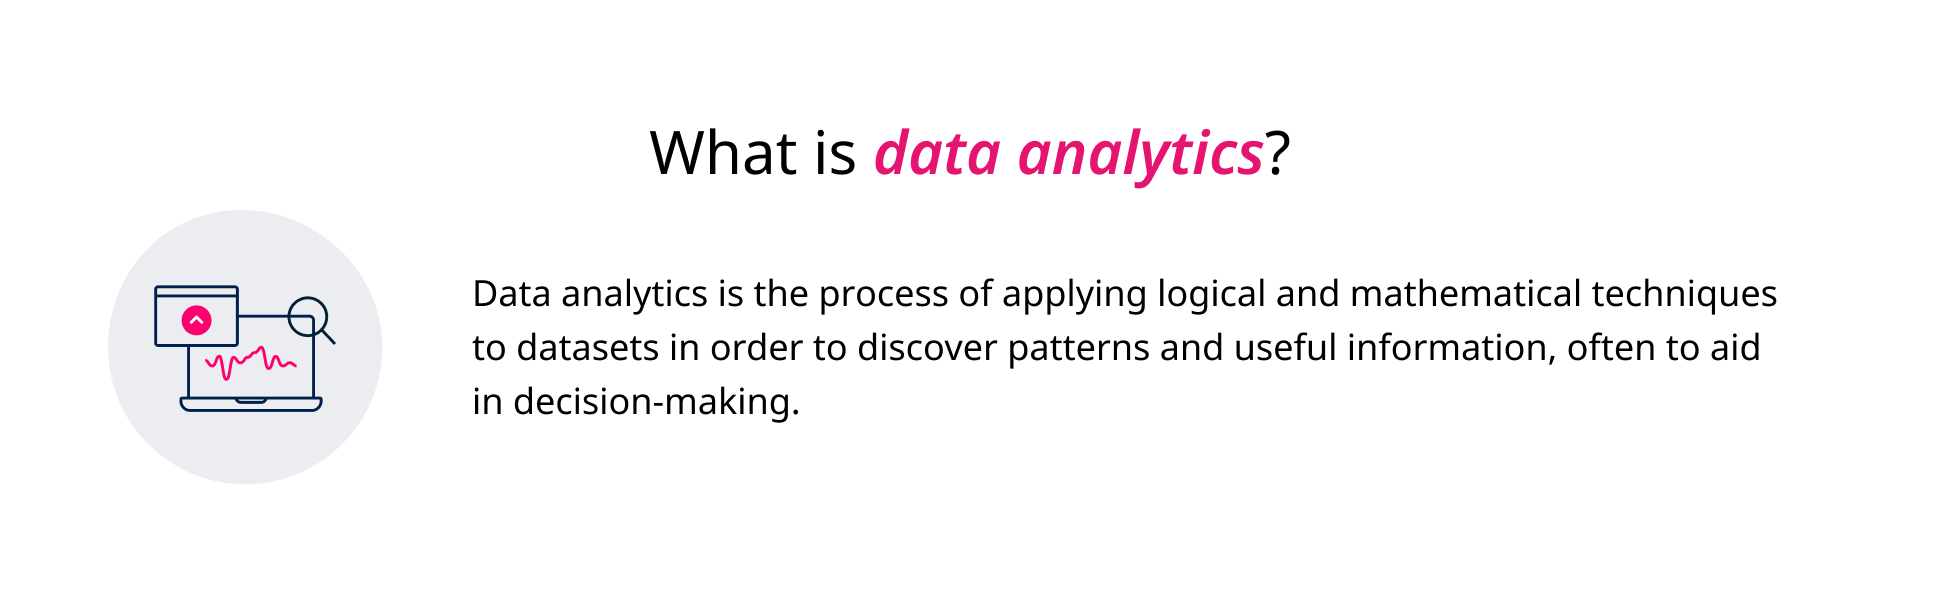
What is data analysis?
Data analysis, or data analytics, is the process of applying logical and mathematical techniques to datasets in order to discover patterns and useful information, often to aid in decision-making.3
It’s often used on an industrial scale, helping organizations make calculated and informed business decisions. As the Internet of Things (IoT) expands and technology develops, new forms of data mining and analysis are constantly emerging.
Big data is characterized by the three V’s: Volume, the massive scale of data; velocity, the speed at which it’s generated and processed; and variety, the wide range of structured and unstructured data formats.4
Velocity is particularly important, as the need for real-time analysis has led to the integration of big data with advanced technologies like machine learning and artificial intelligence.
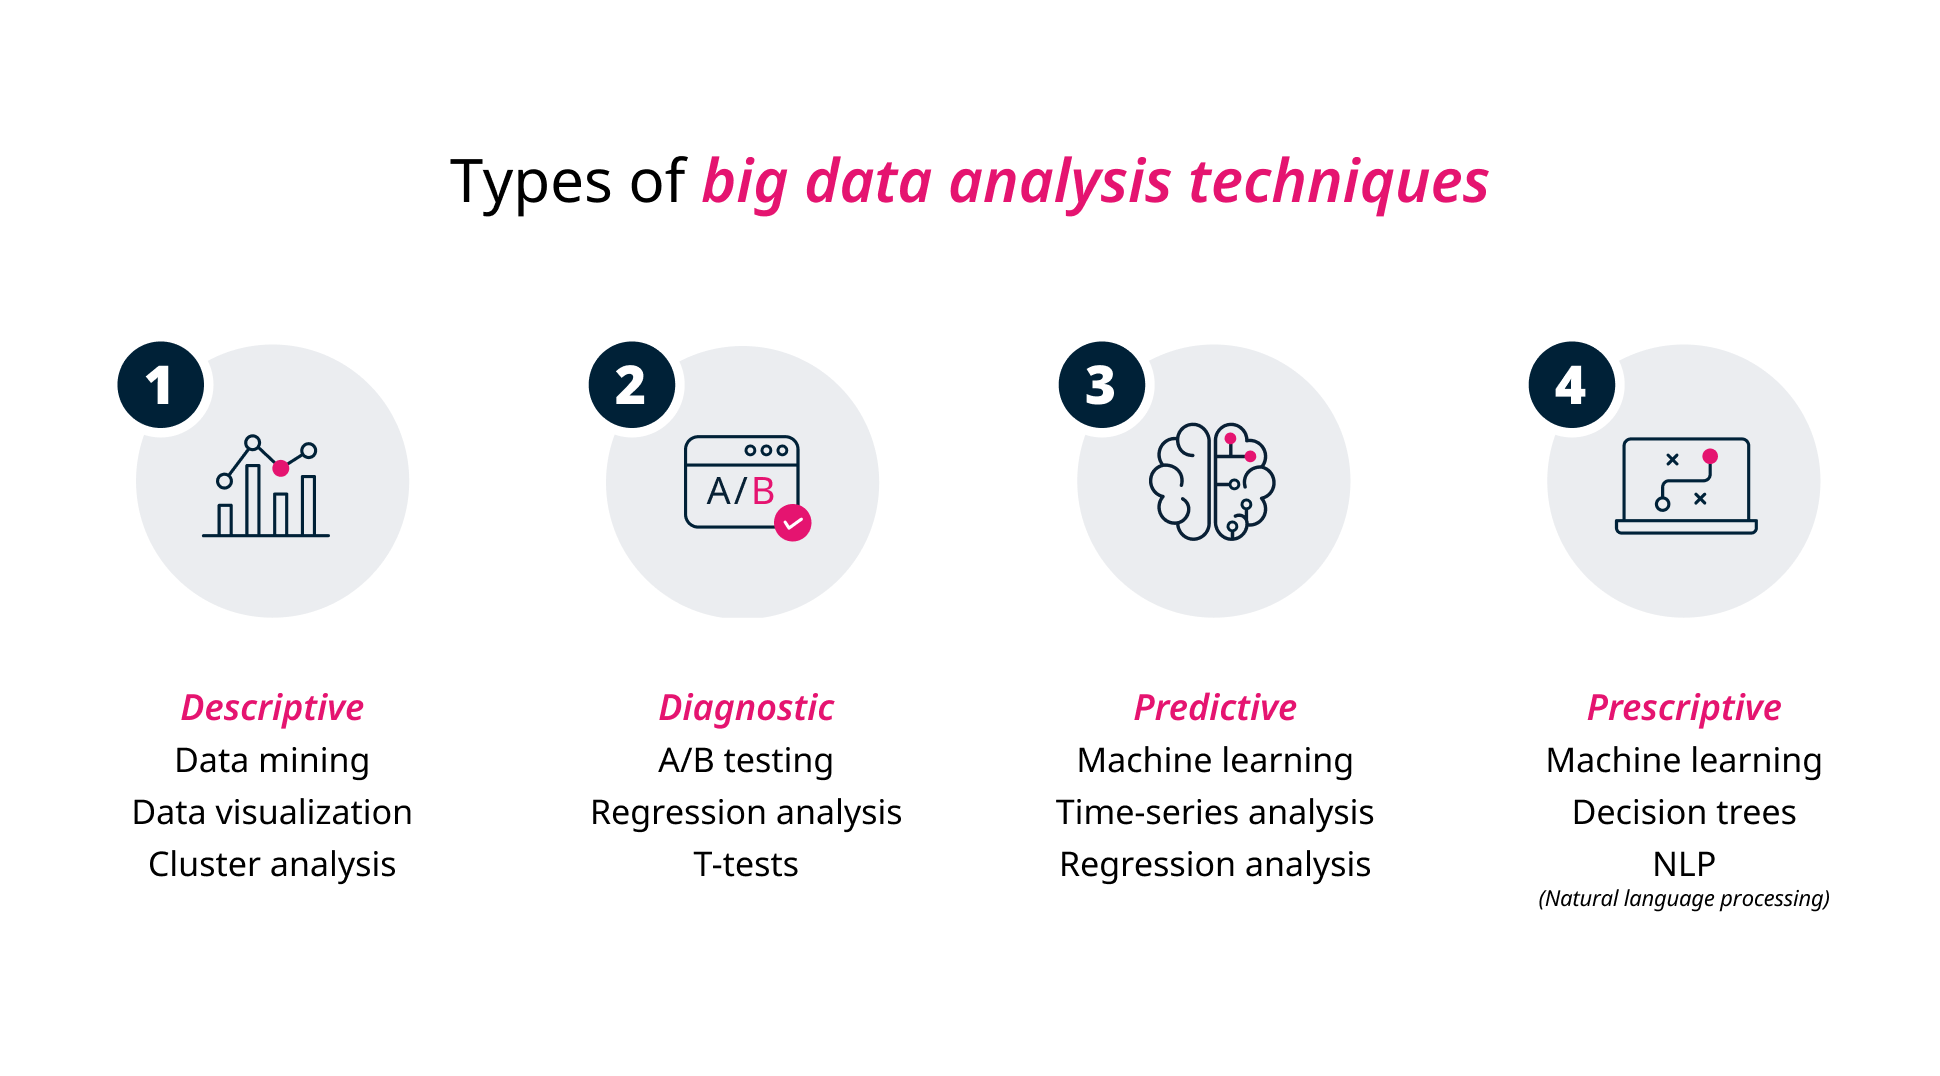
What are the types of data analysis?
The different types of data analysis provide a structured approach to gaining insights from data, moving from understanding what has happened to predicting what will happen and, finally, prescribing a course of action. The four main types of data analysis are:5
Descriptive analytics: Summarizes historical data to explain what happened. This could include generating reports, KPI dashboards, and summaries. It helps you understand the past and present state of data.
Diagnostic analytics: Focuses on historical data to determine why something happened. It involves techniques like regression analysis and A/B testing to find the variables that lead to a specific outcome.
Predictive analytics: Uses statistical models and machine learning to forecast what is likely to happen in the future. It can be used for tasks like sales forecasting, risk assessment, and identifying behavior trends.
Prescriptive analytics: Recommends what should be done to achieve a desired outcome. It leverages advanced techniques like simulation and natural language processing.
10 examples of big data analytics techniques
Big data analytics techniques function in a two-fold manner: processing data streams as they emerge and performing batch analysis on data as it accumulates to identify patterns and trends. As data generation accelerates, these techniques must evolve to handle the speed, scale, and depth of information.
1. Data mining
Data mining extracts patterns from large data sets by combining methods from statistics and machine learning, within database management. Today, it is increasingly automated and integrated with AI, allowing for more complex pattern detection.6
- Tools: Data-mining tools include programming languages like Python or R, and proprietary tools like KNIME and RapidMiner, which offer visual workflows and pre-built algorithms.
- Example: A retail company might use data mining to analyze customer purchasing histories and identify which segments are most likely to respond to a new product promotion.
2. Data visualization
Data visualization is the graphical representation of data and information. Through visual elements like charts, graphs, and dashboards, analysts communicate insights and help stakeholders make decisions. It can also make complex data understandable and accessible to non-technical users.7
- Tools: Data visualization softwares like Tableau and Power BI are powerful packages with built-in charting tools. There are also coding libraries that can power highly-customized visualizations, like D3.
- Example: A business dashboard can display real-time sales data using a line chart to show a trend over time or a heat map to show customer density.
3. Cluster analysis
Cluster analysis is a type of data mining that uses unsupervised machine learning in order to group data points into distinct clusters based on their similarities. The goal is to identify hidden groupings or structures within the data without any pre-existing labels.8
- Tools: Common tools and libraries for cluster analysis include Scikit-learn in Python and R.
- Example: A bank might use cluster analysis to segment customers’ behavior and detect fraudulent transactions by identifying groupings of unusual activity.
4. A/B testing
This data analysis technique involves comparing a control group with a variety of test groups to discern what changes will improve or change a given objective variable.9
- Tools: Software and platforms like Adobe Target, A/B Smartly, and VWO offer features for creating, monitoring, and analyzing a variety of web-based A/B tests.
- Example: A marketing team could use A/B testing to determine which website layout or ad copy leads to the highest number of conversions.
5. Regression analysis
Regression analysis is a statistical method for estimating the relationships among variables. It’s used to understand how the value of a dependent variable changes when one of the independent variables is varied.10
- Tools: Statistical software like SAS and SPSS, and programming languages like R and Python are used for regression analysis.
- Example: A real estate agent could use regression analysis to determine the relationship between house size and selling price.
6. T-tests
A t-test is a statistical hypothesis test used to determine if there is a significant difference between the averages of two groups. It helps to see if they are genuinely different or if the observed difference is due to chance.11
- Tools: T-tests are available in statistical software like R and Python’s SciPy library.
- Example: A teacher could use a t-test to compare the average test scores of students who tried a new study method versus those who tried an old method, to see if there is a meaningful difference in their performance.
7. Machine learning
Machine learning automates model building for analytics. It enables computers to automatically learn from data without explicit programming to make inferences, predictions, and recommendations.12
- Tools: Popular tools and platforms for machine learning include Databricks, KNIME, and cloud-based services like Google Cloud AI and Amazon SageMaker.
- Example: Machine learning can be used by banks to detect fraud and identify suspicious credit card transactions automatically.
8. Time-series analysis
Time-series analysis is a statistical technique that analyzes data points collected over a period of time. The goal is to identify patterns, trends, and seasonal changes in the data.13
- Tools: Some tools for time-series analysis include Python libraries like Pandas, Statsmodels, and specialized platforms like Amazon Forecast.
- Example: Weather forecasters might use this kind of analysis to predict future weather conditions based on past temperature, pressure, and wind patterns.
9. Decision trees
Decision trees are a type of supervised machine learning algorithm that can be used for both classification and regression. It works like a flow chart, identifying optimal split points based on feature values to create pure subsets.14
- Tools: Decision-tree algorithms are implemented using various machine learning libraries, including Scikit-learn in Python and R.
- Example: A business could use a decision tree to predict whether or not a customer will buy a product, based on factors such as previous purchasing history, age, and location.
10. Natural language processing
Natural language processing (NLP) is a subset of AI and machine learning that uses algorithms to analyze, understand, and generate human language. Large language models (LLMs) and generative AI enable tools to process massive amounts of unstructured text data, such as emails, social media posts, and customer reviews.15
- Tools: Popular NLP tools include programming libraries like NLTK and spaCy, and the IBM Watson platform.
- Example: NLP is used for machine translation services, like Google Translate, to process input text and return that same information in a number of different languages.
Learn how to sort, analyze, and interpret data to inform business strategy with data analysis short courses on GetSmarter.


- 1 (2024). ‘Big Data Market Size, Share & Growth, Industry Report, 2030.’ Retrieved from Grand View Research.
- 2 Marr, B. (Dec, 2021). ‘How much data do we create every day? The mind-blowing stats everyone should read’. Retrieved from Forbes.
- 3 (Jul, 2025). ‘Data analytics: What it is, how it’s used, and 4 basic techniques.’ Retrieved from Investopedia.
- 4 Sharma, S. (Jul, 2024). ‘Big data: The 3 v’s of data.’ Retrieved from Wevolver.
- 5 (Feb, 2023). ‘Comparing descriptive, predictive, prescriptive, and diagnostic analytics.’ Retrieved from Insight Software.
- 6 (Jun, 2024). ‘What is data mining?’ Retrieved from IBM.
- 7 (Nd). ‘What is data visualization? Definition, examples, and learning resources.’ Retrieved from Tableau. Accessed on August 6, 2025.
- 8 (Jul, 2025). ‘Data mining – cluster analysis.’ Retrieved from GeeksforGeeks.
- 9 (Jul, 2025). ‘A/B testing — What it is, examples, and best practices.’ Retrieved from Adobe for Business.
- 10 Beers, B. (May, 2025). ‘Regression: Definition, analysis, calculation, and example.’ Retrieved from Investopedia.
- 11 Bevans, R. (Jun, 2023). ‘An introduction to t tests – definitions, formula and examples.’ Retrieved from Scribbr.
- 12 Mostert, B. (Jan, 2023). ‘What is machine learning for analytics?’ Retrieved from Oracle.
- 13 (Nd). ‘What is time series analysis?’ Retrieved from Sigma. Accessed on August 8, 2025.
- 14 (Aug, 2025). ‘Decision tree in machine learning.’ Retrieved from GeeksforGeeks.
- 15 Holdsworth, J. (Aug, 2024). ‘What is NLP (natural language processing)?’ Retrieved from IBMn.